by Jeffrey Saut, Chief Investment Strategist, Raymond James
If you can keep your head when all about you
Are losing theirs and blaming it on you,
If you can trust yourself when all men doubt you,
But make allowance for their doubting too;
If you can wait and not be tired by waiting,
Or being lied about, don’t deal in lies,
Or being hated, don’t give way to hating,
And yet don’t look too good, nor talk too wise. . .
. . . Rudyard Kipling
We really like Rudyard Kipling’s line, “If you can trust yourself when all men doubt you, but make allowance for their doubting too;” and clearly “men” doubted us when on October 2 (Tuesday, two weeks ago tomorrow) our short-term proprietary model flashed a sell signal and we subsequently advised selling trading positions. It was a good “call” even though we had no idea the decline would be that severe as it spilled over into a minicrash last Wednesday! We also thought Andrew did a very good job of identifying the trading bottom late last week.
Quite frankly I would have used my long standing mantra, “never on a Friday” instead of predicting a bottom. Indeed, once the equity markets get into one of these selling skeins they tend not to bottom on a Friday preferring to have participants brood about their losses over the weekend and show up in “sell mode” on Monday/Tuesday of the following week. I would have thought that sequence should have played last week given the Italian cabinet’s budget talks over the weekend that may just determine if Italy stays in the EU or leaves. So we will see if last week’s low proves to be the bottom.
While there have been a plethora of pedestrian reasons offered up for what caused the indiscriminate selling we continue to like Monaco Capital founder Joe Monaco’s reason that we paraphrased in last Thursday’s “Morning Tack:”
With all the current “chaos” in the media, I have to complete my thought and tell you what I am convinced is going on. The People’s Republic of China has three major objectives right now:
1) Hurt the USA,
2)Prop-up their currency, and
3) Obtain cash to stimulate their economy.
Therefore, given the fact that U.S. treasuries are getting clocked, but utilities are rallying, I am convinced the jump in interest rates is due to the Chinese selling vast amounts of their treasury holdings.
By selling them they,
1) push U.S. interest rates higher which, hurts the U.S. consumer and possibly President Trump’s approval rating right before an election,
2) They get billions of U.S. dollars, allowing them make open market purchases of the renminbi, which supports its value in international markets, and
3) with all those renminbi they can now freely spend inside the country of China to stimulate their economy.
With one transaction they accomplish three major objectives. This is the only thing that makes sense to me. And if I am right, once that selling subsides we are in for one major rally in the U.S. financial markets.
Folks, to us that makes about as much sense as anything to explain this disconnect between the rising utility index and the declining Treasury prices (higher yields). As for the equity markets, we have heard a number of market pundits on CNBC, which did not even see this pullback coming that now expect the equity markets to go lower. Why does anyone listen to these false prophets?!
In this business when you are wrong you say you are wrong and you say it quickly for a de minimis loss of capital!! Our short-term model turned negative after the close two weeks ago from tomorrow (October 2) and we wrote about that telling traders to abandon trading positions on a short-term basis. Coming into this week (that would be early last week) we noted there was a negative energy blast due, which would likely be over by late week.
Well, as Andrew wrote on Friday, it is now late in the week and the near-term negative energy blast is clearly over with a number of finger-to-wallet indicators (90% Downside Day, 3 standard deviations below the 50-day moving average, RSI, MACD, etc.) suggesting the equity markets are just plain washed-out as can be seen in the following “fear chart.”
In fact, many of the indicators were at the washed-out levels late last week that we identified at the February 9, 2018 “undercut low,” which we told participants to buy. There were also rumors that in addition to the Chinese selling of U.S. fixed income assets, their sovereign wealth funds were piling on by selling U.S. equities, which in turn triggered selling by algos in this country.
Now that we are finally back from the West Coast, and able to look at the stock market’s “internals,” it is evident what has happened is a regime shift and NOT a major stock market top implying this decline should be bought. Indeed, it feels like the previous “laggards have become the leaders” with energy, financials, real estate, healthcare, staples, and utilities moving from an underperforming status to an outperforming status (by a large 150 basis point) since the anticipated decline began. Meanwhile, the previous leaders, namely tech, took a two session “header” of double-digit proportions.
However, the yield curve steepened last week, and we are not referring to the false 2-year to 10-year Treasure T-note spread, but the “real” yield curve using the 90-day T-note to the 30-years T-bond. We believe we are in a rising interest rate environment akin to the 1940s to 1980s where rising interest rates were associated with rising stock prices.
The call for this week: It is unbelievable to us that investors are listening to pundits that NEVER saw the decline coming, yet now want to tell us why the decline happened. Ladies and gentlemen, the important thing to know is that a decline was coming and Andrew and I said so two weeks ago before the decline began. Andrew did an excellent job of calling the bottom late last week and we will see this week if that call was correct.
We will say, our breadth model triggered a “buy signal” last week, the CBOE Put/Call ratio – a contrary indicator showing participants have become too bearish in the near term with way too many “puts” being purchased than “calls” – and the steepening “real” yield curve is suggestive of positive economic growth going forward. Capital expenditures have picked up and earnings remain strong, all of which imply the S&P 500 (SPX/2767.13) should be above 3000 by year end.
We are unconcerned with “probabilities” that stocks will trade at X-times this or that projected earnings estimate since all that is important is the primary trend of the equity markets; and, the primary trend remains UP. As we write, preopening S&P 500 futures are off 13 points on higher oil prices, which are due to U.S.-Saudi threats and the comment from the ambassador to the U.S. that China doesn’t want a trade war but will respond to U.S. actions.
Barring news or developments, traders will buy the probable early decline because they are bullish for the Monday and expiry rallies.
Chart 1
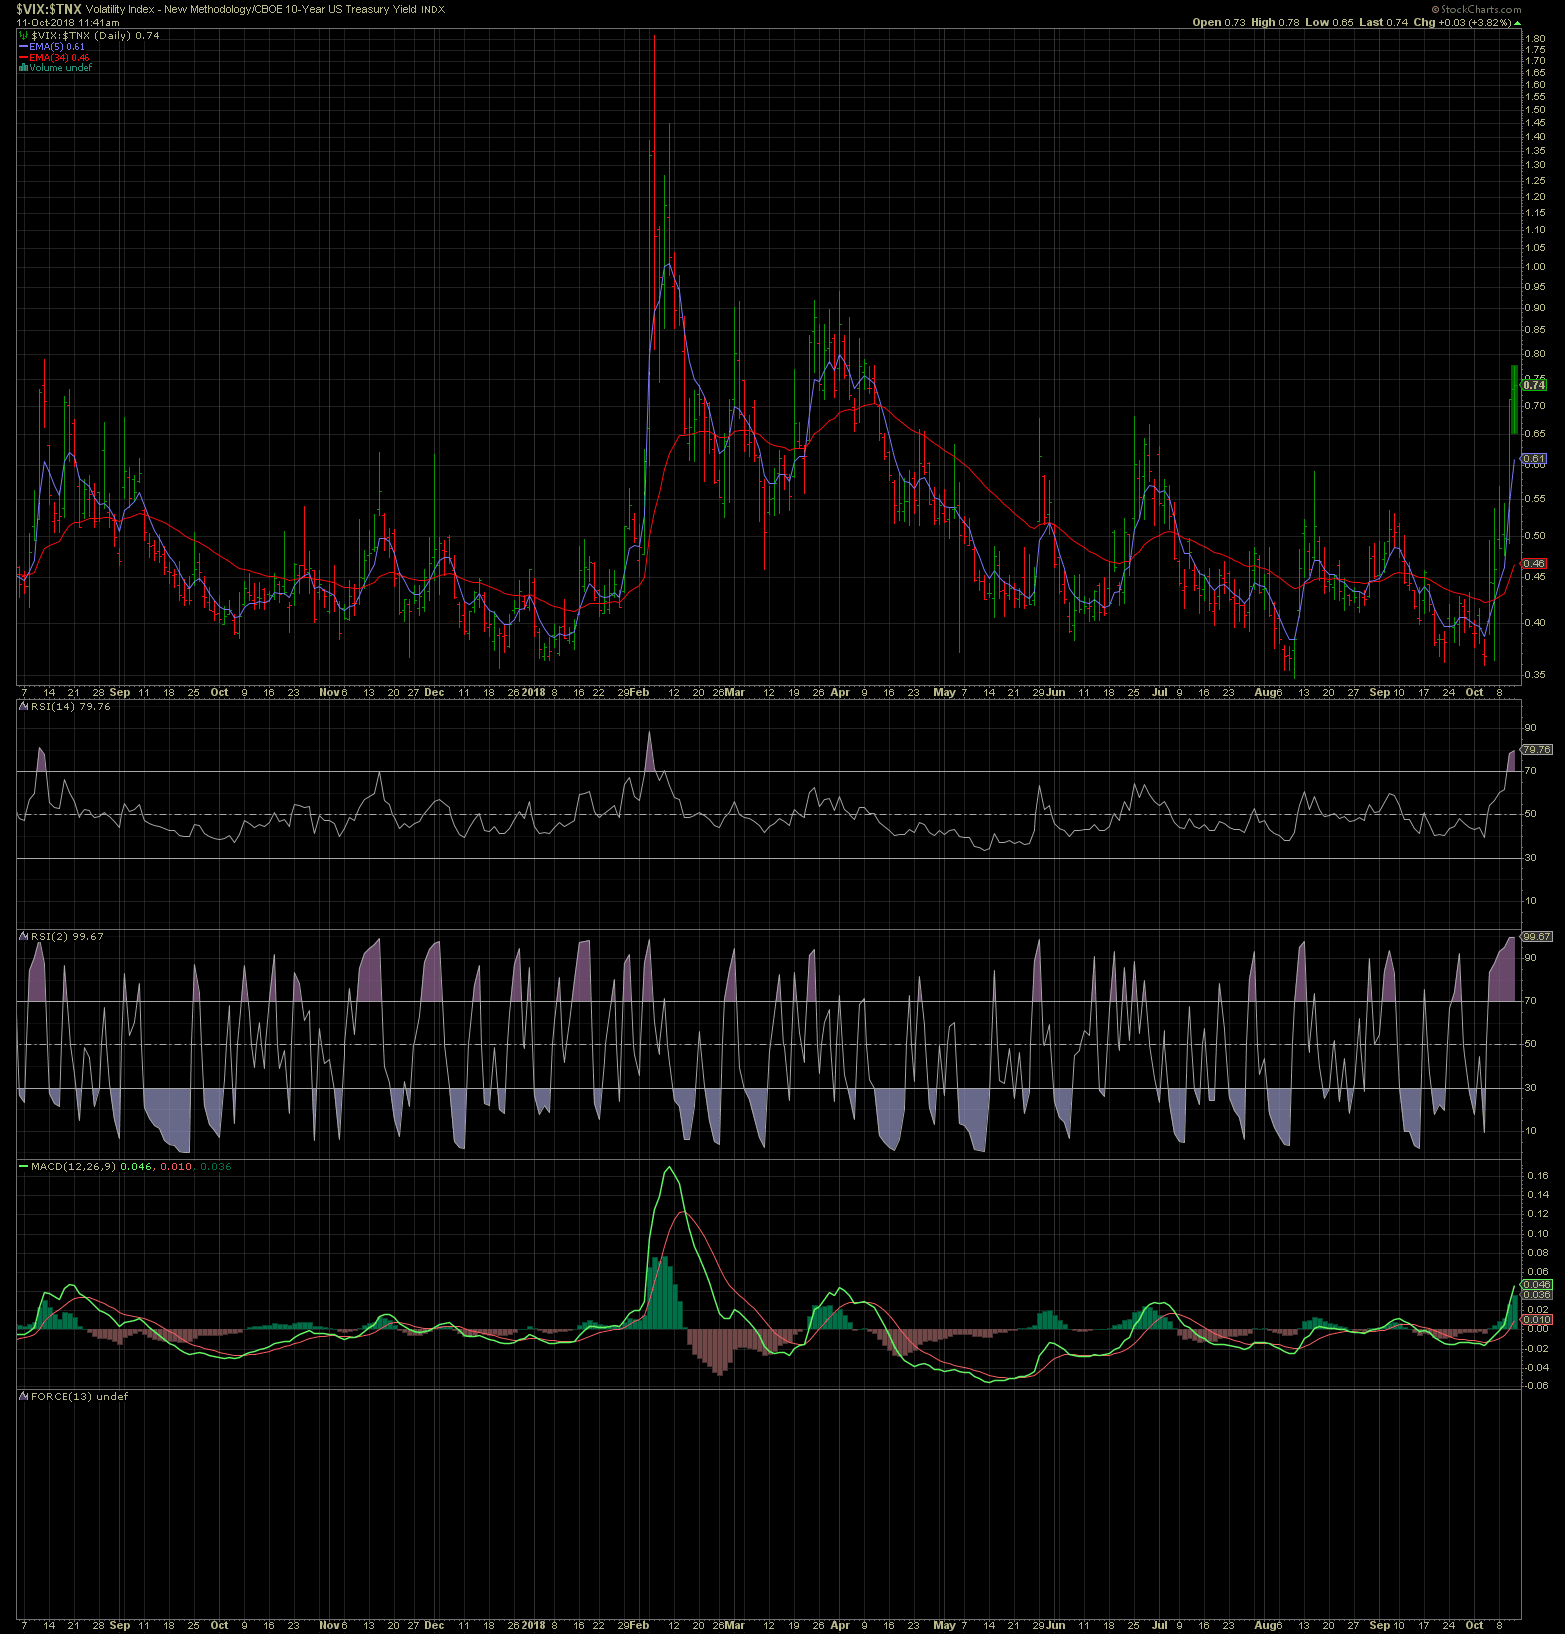
Click here to enlarge
Source: StockCharts
Additional information is available on request. This document may not be reprinted without permission.
Raymond James & Associates may make a market in stocks mentioned in this report and may have managed/co-managed a public/follow-on offering of these shares or otherwise provided investment banking services to companies mentioned in this report in the past three years.
RJ&A or its officers, employees, or affiliates may 1) currently own shares, options, rights or warrants and/or 2) execute transactions in the securities mentioned in this report that may or may not be consistent with this report’s conclusions.
The opinions offered by Mr. Saut should be considered a part of your overall decision-making process. For more information about this report – to discuss how this outlook may affect your personal situation and/or to learn how this insight may be incorporated into your investment strategy – please contact your Raymond James Financial Advisor.
All expressions of opinion reflect the judgment of the Equity Research Department of Raymond James & Associates at this time and are subject to change. Information has been obtained from sources considered reliable, but we do not guarantee that the material presented is accurate or that it provides a complete description of the securities, markets or developments mentioned. Other Raymond James departments may have information that is not available to the Equity Research Department about companies mentioned. We may, from time to time, have a position in the securities mentioned and may execute transactions that may not be consistent with this presentation’s conclusions. We may perform investment banking or other services for, or solicit investment banking business from, any company mentioned. Investments mentioned are subject to availability and market conditions. All yields represent past performance and may not be indicative of future results. Raymond James & Associates, Raymond James Financial Services and Raymond James Ltd. are wholly-owned subsidiaries of Raymond James Financial.
International securities involve additional risks such as currency fluctuations, differing financial accounting standards, and possible political and economic instability. These risks are greater in emerging markets.
Investors should consider the investment objectives, risks, and charges and expenses of mutual funds carefully before investing. The prospectus contains this and other information about mutual funds. The prospectus is available from your financial advisor and should be read carefully before investing.
Copyright © Raymond James