
Back in the summer, a big gap opened up between high flying US indices that were hitting new all-time highs and overseas indices like the Dax or Hang Seng which were down over 10% and 20% off their 52-week highs. In recent weeks, we have been wondering whether the gap would be closed by a US selloff or a recovery elsewhere. In the last few days, US indices have started to retreat with selling pressure and volatility increasing.
Part of the reason for the decline may be related to some of our recent Equity Leaders Weekly comments coming to pass. Two weeks ago, we noted that the US 30-year Treasury Yield was retesting its May high and that a breakout could be bearish for stocks just as the yield breakout back in February sparked a selloff in stocks. Since then, both the 30-year and the 10-year yields have broken out to their highest levels since 2011 and 2014 respectively.
Interest rates have been pushed up by expectations that the combination of a strong US economy and rising inflation could keep the Fed raising interest rates for another year or more. Breakouts to the upside by Brent Crude, mentioned two weeks ago, and Natural Gas, which we discussed last week have the potential to add to inflation pressures.
In this issue of Equity Leaders Weekly, we take a look at the what the VIX is telling us about volatility in the market and the near-term outlook for stocks. We also look at capital flows between sectors in the stock market in our monthly Sector Scopes review.
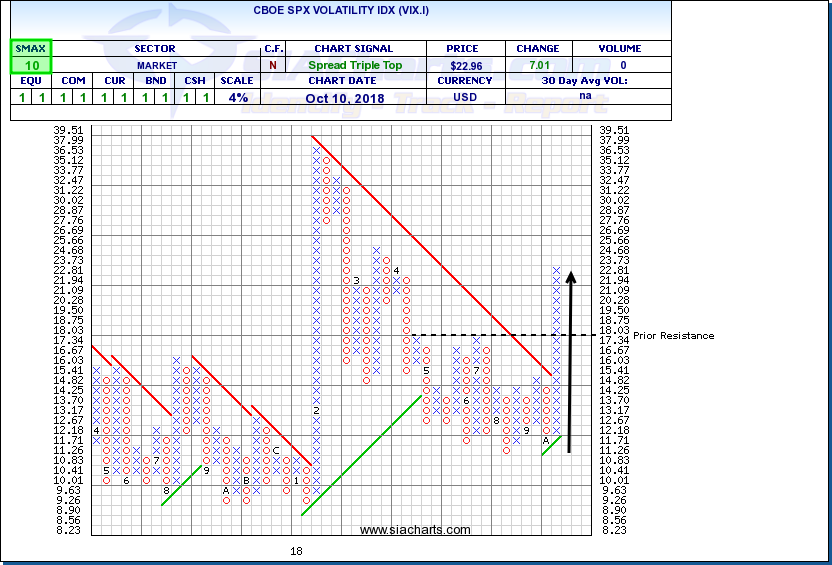
CBOE SPX Volatility Index (VIX.I) and Earnings Season
The CBOE Volatility Index, or VIX.I, is commonly seen by investors as a gauge of fear versus complacency in the marketplace. When stocks sold off at the start of the year, the VIX spiked, then it declined as US indices regained their footing and advanced to new all-time highs. By late summer, it had seemed like complacency had set in once again. Since the start of October, however, the VIX has been creeping back upward and really jumped yesterday, indicating that markets could be in for a rough ride in the coming weeks.
October has historically been a volatile month of the year for stocks to begin with and there are a number of factors that could spark market swings this month including rising US interest rates, rising commodity prices/inflation pressures and a volatile political situation heading into next month’s midterm elections.
One factor that could potentially cause a lot of volatility in the coming weeks, particularly for individual stocks that has received less air time is the upcoming earnings season. A result of US stocks holding high while overseas markets sold off back in the summer is that expectations for US earnings are now higher and companies need to deliver strong results in order to justify high expectations. At this point, it wouldn’t take much to send investors running for the exits, and even small disappointments could have a big impact on share prices.
Earnings season starts on Friday with results from big US banks and really picks up over the next few weeks with many of the largest, market moving companies due to report by the end of the month.
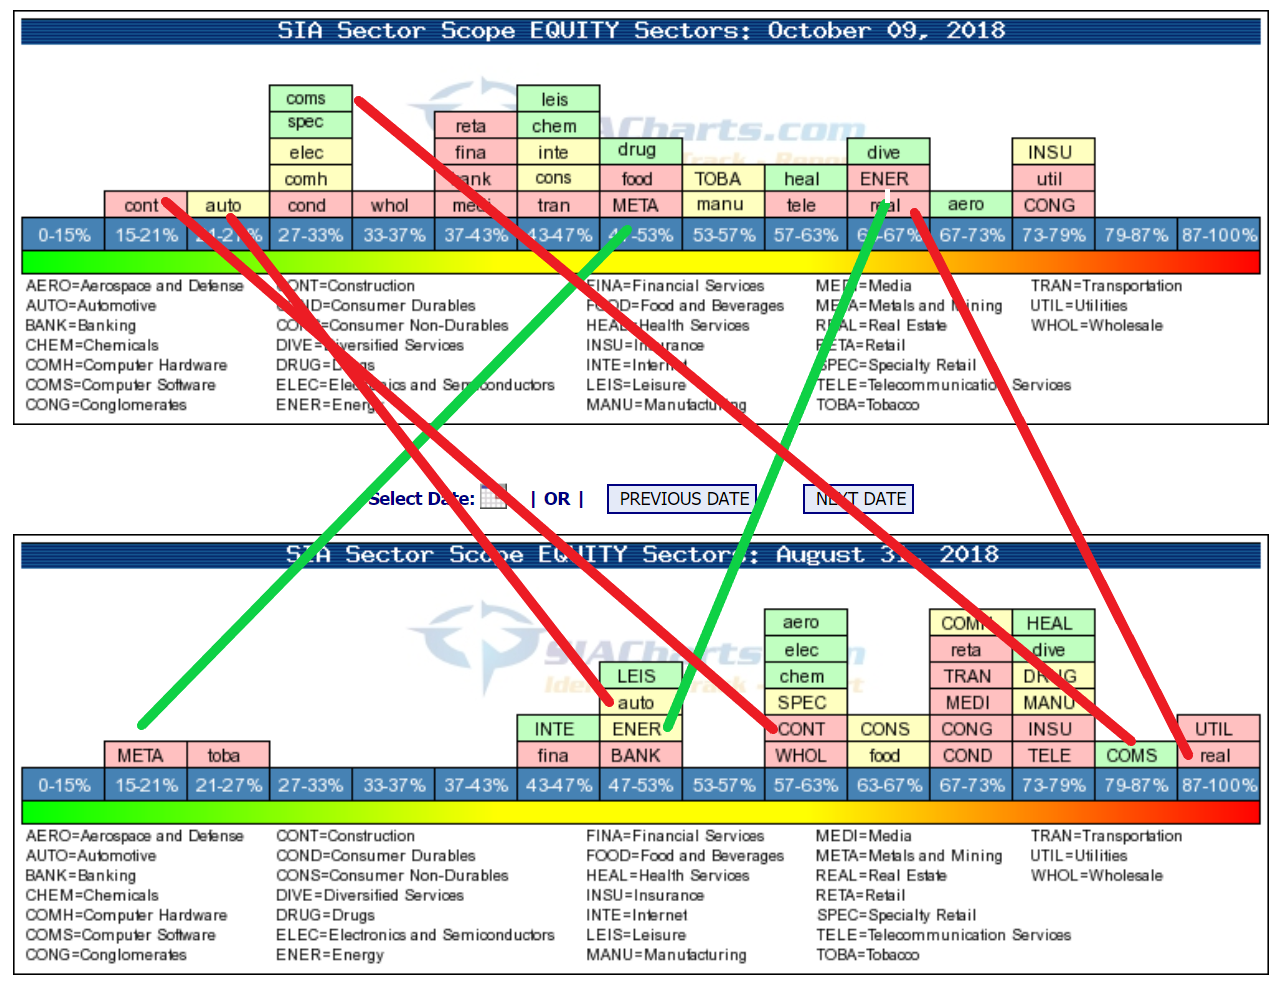
Monthly Sector Scopes Update
The Sector Scopes area of the SIACharts website measures the Bullish Percent (percentage of stocks in the group on a point and figure technical bullish signal) for 31 sectors. Changes in the chart over time tell us about capital flows among stock market groups.
Comparing charts between late August and now shows a definite leftward (bearish) shift in the market. By late August, many of the groups were starting to cluster toward the right side indicating a market that was getting a bit overheated. Currently, it looks like some of the frothiness has come out and the sectors are more balanced, but if investors are in a correction mood, there is more downside room as most sectors are nowhere close to being oversold.
There have been a number of significant changes in sentiment toward various sectors in recent weeks. A rebound in commodity prices has sparked renewed interest and rightward (bullish) moves for Energy and Mining stocks. Rising energy costs, however, have also had a negative impact on some groups, particularly transportation.
Rising interest rates have had a negative impact on interest sensitive groups, pushing Real Estate, Financials, and particularly Construction leftward. Even though Canada and the US did reach a trade deal recently, sentiment has also turned against the Auto Sector because steel tariffs, which have been a big drag on the earnings of US automakers, remain in place.
Computer Software also moved sharply leftward which could be due to capital pulling out of some of the higher beta groups, but it also may have been affected by the recent reshuffling the market sectors that saw some Technology companies move into the new Communications group.
SIACharts.com specifically represents that it does not give investment advice or advocate the purchase or sale of any security or investment. None of the information contained in this website or document constitutes an offer to sell or the solicitation of an offer to buy any security or other investment or an offer to provide investment services of any kind. Neither SIACharts.com (FundCharts Inc.) nor its third party content providers shall be liable for any errors, inaccuracies or delays in content, or for any actions taken in reliance thereon.