by Franklin Templeton Investments
The US stock market, as measured by the S&P 500 Index, just reached a historic milestone.
On 22 August 2018, the index went 3,453 days without a correction of 20% or more.1 By that measure, it’s now generally regarded as the longest US equity bull market on record, surpassing the previous record bull run that lasted from October 1990 to March 2000.2 That record ended when the Dot-Com bubble burst, after valuations for tech stocks disconnected from earnings and reality.
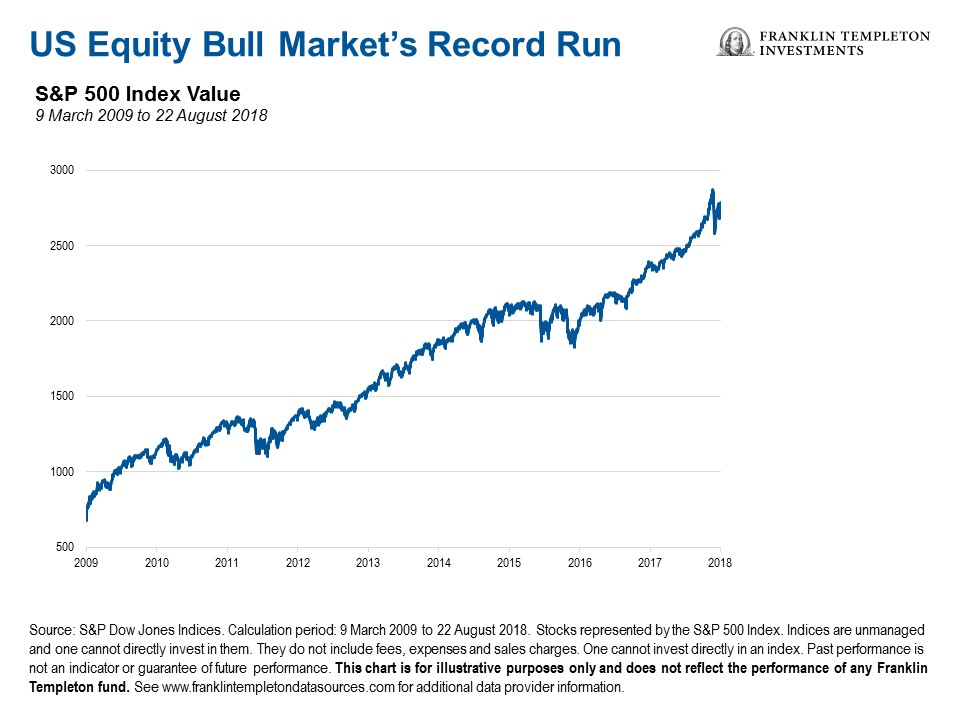
Most observers generally cite 9 March 2009, as the start of the bull market. Since then, the S&P 500 Index has risen more than 300%, as the chart below shows.

As we mentioned in a previous article, the current bull market has shrugged off some notable corrections, defined as a decline of 10% or more.3 It’s weathered the beginning and end of US quantitative easing and crises in other parts of the world.
For example, the S&P 500 Index fell 19% during the European debt crisis from April to June 2011.4 However, the market proved to be resilient and finished 2011 up 2% for the year.5
Even the selloff in early February of this year—when the S&P 500 Index saw its largest one-day percentage fall since 2011—didn’t lead to a longer correction. And as at mid-August 2018, the index hovered near the record high of 2,873 set on 26 January 2018.6
Meanwhile, some of our investment professionals have questioned how long the ageing bull market can go on, despite leading US economic indicators that continue to point to robust growth.
Investment Implications
At Franklin Templeton, we’ve been investing in global markets for more than 65 years, across bull and bear markets alike. While nobody can predict when the current bull market will end, we focus on the long term.
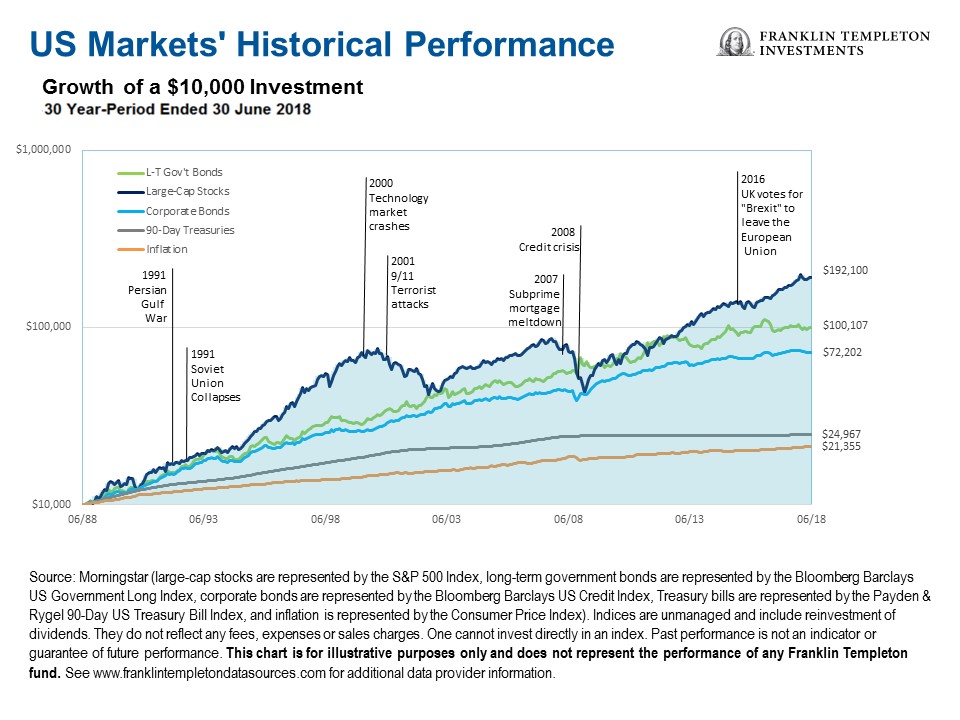
As the chart below shows, US stocks, as well as other asset classes, have tended to rebound after several notable market events over the past 30 years.

*****
The comments, opinions and analyses expressed herein are for informational purposes only and should not be considered individual investment advice or recommendations to invest in any security or to adopt any investment strategy. Because market and economic conditions are subject to rapid change, comments, opinions and analyses are rendered as of the date of the posting and may change without notice. The material is not intended as a complete analysis of every material fact regarding any country, region, market, industry, investment or strategy.
Data from third-party sources may have been used in the preparation of this material and Franklin Templeton Investments (“FTI”) has not independently verified, validated or audited such data. FTI accepts no liability whatsoever for any loss arising from use of this information and reliance upon the comments, opinions and analyses in the material is at the sole discretion of the user. Products, services and information may not be available in all jurisdictions and are offered by FTI affiliates and/or their distributors as local laws and regulations permit. Please consult your own professional adviser for further information on availability of products and services in your jurisdiction.
Get more perspectives from Franklin Templeton Investments delivered to your inbox. Subscribe to the Beyond Bulls & Bears blog.
For timely investing tidbits, follow us on Twitter @FTI_Global and on LinkedIn.
What Are the Risks?
All investments involve risks, including possible loss of principal. Stock prices fluctuate, sometimes rapidly and dramatically, due to factors affecting individual companies, particular industries or sectors, or general market conditions.
_________________________________________________________________________________
1. Source: S&P Dow Jones Indices, as at 22 August 2018. Stocks represented by the S&P 500 Index. Indices are unmanaged and one cannot directly invest in them. They do not include fees, expenses and sales charges. Past performance is not an indicator or guarantee of future performance. See www.franklintempletondatasources.com for additional data provider information.
2. Ibid.
3. Ibid.
4. Ibid.
5. Ibid.
6. Ibid.


