
This in week in the Equity Leaders Weekly we are going to investigate the base metals space by analyzing the Copper Continuous Contract chart to see how the commodity has fared since it was last discussed. We will also take a look at the iShares Global Base Metals ETF to see if there are any insights into what the outlook for these base metals equities looks like.
High Grade Copper Continuous Contract (HG.F)
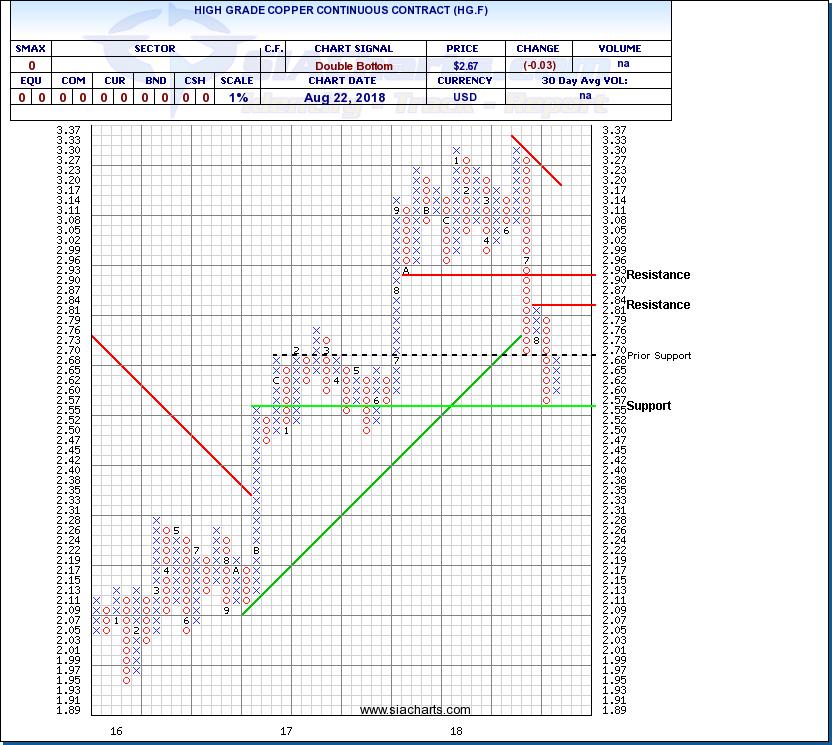
Because it has so many applications and is used by a wide variety of industries, Copper is widely considered to be the commodity most sensitive to the world economy, earning the nickname “Dr. Copper” for its role as a barometer of economic conditions. In recent years, Copper has been particularly sensitive to changes in sentiment toward the Chinese economy with China having become a significant component of copper demand in its growth phase. With continuing trade tensions and a possible slowdown in growth in the Chinese economy the commodity continues to come under pressure with prices now sitting at the $2.67 level on Wednesday’s close.
Taking a look at the chart we have seen a free fall since mid June where the price has collapsed from $3.30 all the way to below $2.60 with a small bounce to where it is currently sitting at $2.67. Should this column of X’s continue, HG.F will look to break through the previous support level of $2.70 and look to push back towards resistance at $2.84, where it failed earlier this month. Above this the $2.93 level may provide additional resistance. Support for HG.F comes into play at $2.55. With an SMAX score of 0, the short term outlook for Copper remains very weak.
iShares S&P/TSX Global Base Metals Index ETF (XBM.TO)
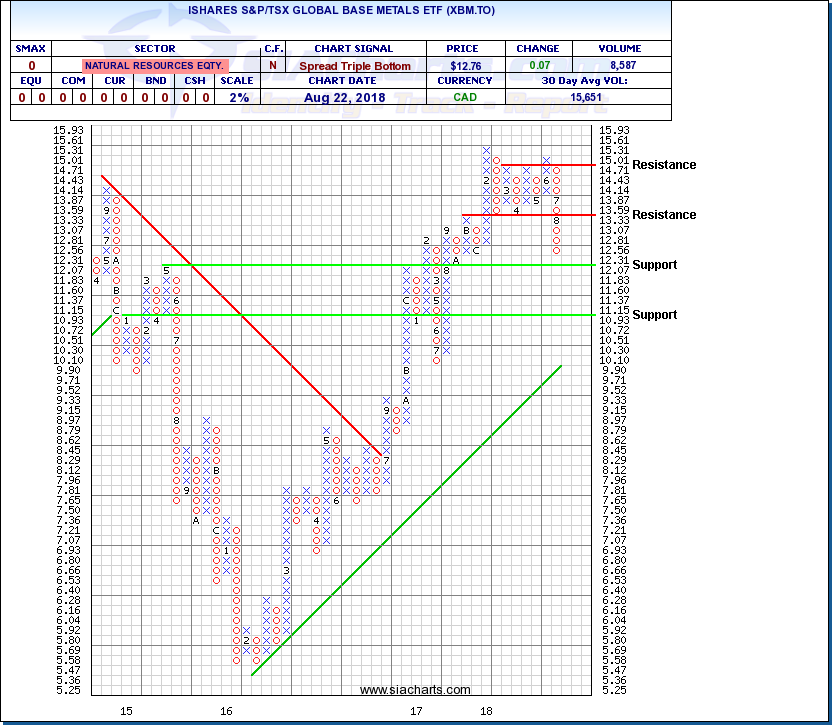
The iShares S&P/TSX Global Base Metals Index ETF (XBM.TO) is a global sector play and has exposure to companies that produce or extract base metals around the world. Geographically the make up of the index is Canada (32%), United States (24%), United Kingdom (20%), Australia (10%) with India, China and Peru making up the rest. After a great run in 2016 and 2017, the Canadian ETF has struggled to keep the pace as critical commodity prices like copper have also struggled in 2018. Other base metals include aluminum, lead, nickel and zinc.
Looking at the 2% chart for XBM.TO we can see that 2016 and 2017 was a pretty steady uptrend with periods of consolidation and breakouts. After a large pull back from February to July 2017, the ETF rebounded back and in February of this year broke through its highs not seen since September of 2014. XBM.TO was unable to get over the $15.60 hump and has since moved into a consolidation phase, breaking down below support around $13.50. Just above the $12 mark will be the next key level to watch for possible support. A move below this could signal weakness to $11. A rebound could see resistance come into play around $13.50 and $15. With an SMAX of 0 out of 10, XBM.TO is showing no near-term strength versus the asset classes.
SIACharts.com specifically represents that it does not give investment advice or advocate the purchase or sale of any security or investment. None of the information contained in this website or document constitutes an offer to sell or the solicitation of an offer to buy any security or other investment or an offer to provide investment services of any kind. Neither SIACharts.com (FundCharts Inc.) nor its third party content providers shall be liable for any errors, inaccuracies or delays in content, or for any actions taken in reliance thereon.