
There continues to be some noise around trade, but who are we kidding, this week it’s all about earnings for investors. The peak three weeks of earnings season is now underway with the focus shifting from Financials to Industrials, Health Care and Consumer Products, with Big Tech still putting out results and Big Energy about to start.
For the most part, results have been coming in as expected but there are some undercurrents worth noting.
1) The rising US Dollar is starting to have a negative impact on some companies, including Netflix, Illinois Tool Works, Whirlpool and General Motors, just to name a few.
2) The impact of rising trade tensions is starting to bite some US companies. So far the biggest impact has been on companies that produce big ticket consumer items like Whirlpool (appliances), Harley-Davidson and General Motors. GM complained that US tariffs on steel and aluminum have increased its raw material costs dramatically.
3) Industrials and small ticket consumer products producers don’t appear to be as impacted by the dollar or trade disputes as of yet. It could be that impact of one customer switching on low price items is smaller than the loss of a high value sale for consumer items. Industrial sales which are often tied to long-term contracts may take more time to be impacted.
Earlier this year, the spectre of rising US interest rates, a rising US Dollar and trade war risks hit many stocks in a big correction. This quarter, rather than painting many stocks and sectors with the same brush, investors appear to be putting more effort into sorting out the winners from the losers, plus determining which companies have stronger prospects in the current economic environment and which companies remain at risk. It also appears that the strong US economy continues to provide a positive environment for corporate earnings, particularly companies with more of a domestic focus.
In this week’s edition of Equity Leaders Weekly, we take a look at how the big cap S&P 100 Index is starting to break out of the doldrums. We also look at India’s Nifty Fifty which has been attracting renewed interest at a time when investors have generally been cautious toward emerging markets.
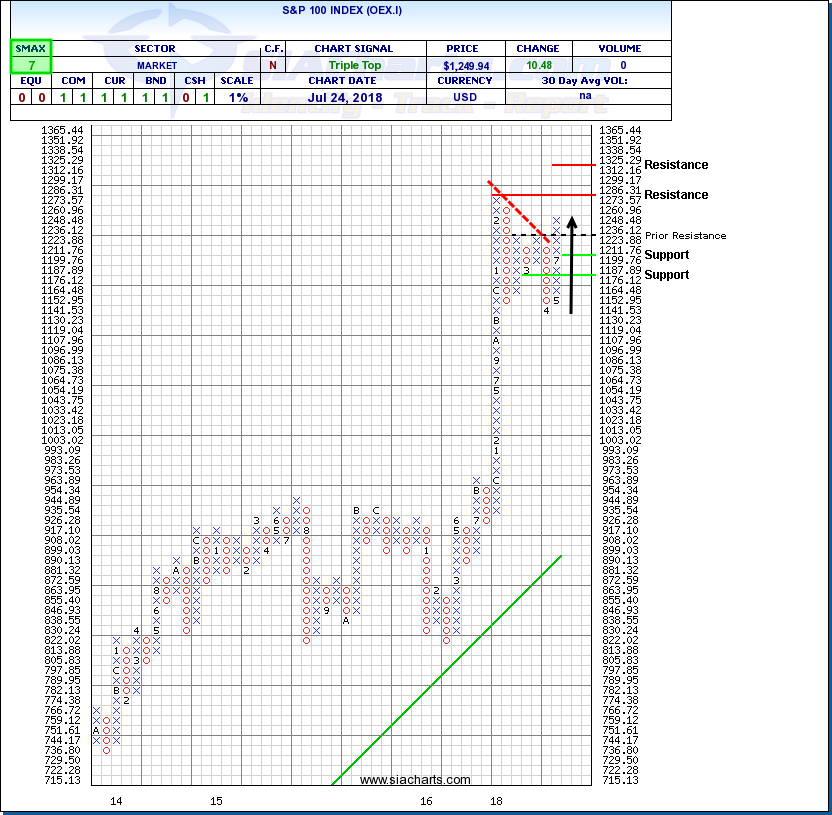
S&P 100 Index (OEX.I)
The index tracking the biggest US stocks staged a massive advance between its December 2016 breakout and February 2018 peak. The huge pole on the chart at right indicates that there were no 3-box, or 4% corrections over that entire time period.
Since February, the tone of the markets has changed. While large cap stocks entered a consolidation phase, small and mid cap stocks took up the baton sending the S&P 600 SmallCap, NASDAQ 100 and S&P/TSX Composite Indices to new all-time highs while the S&P 100 continued to struggle.
Recently, signs have emerged that the S&P 100 may be preparing to resume its primary bull market. The index recently broke out of a downtrend, clearing 1223, and carried on up through 1,236 to complete a bullish Triple Top pattern. The Index still needs to clear its previous high near 1,286 to signal an end to the current sideways consolidation phase. If successful, next resistance may appear near 1,325 based on a horizontal count from the Triple Top. Initial downside support appears near 1,199 then 1,176.
With an SMAX score of 7, OEX.I is exhibiting near-term strength against the asset classes.
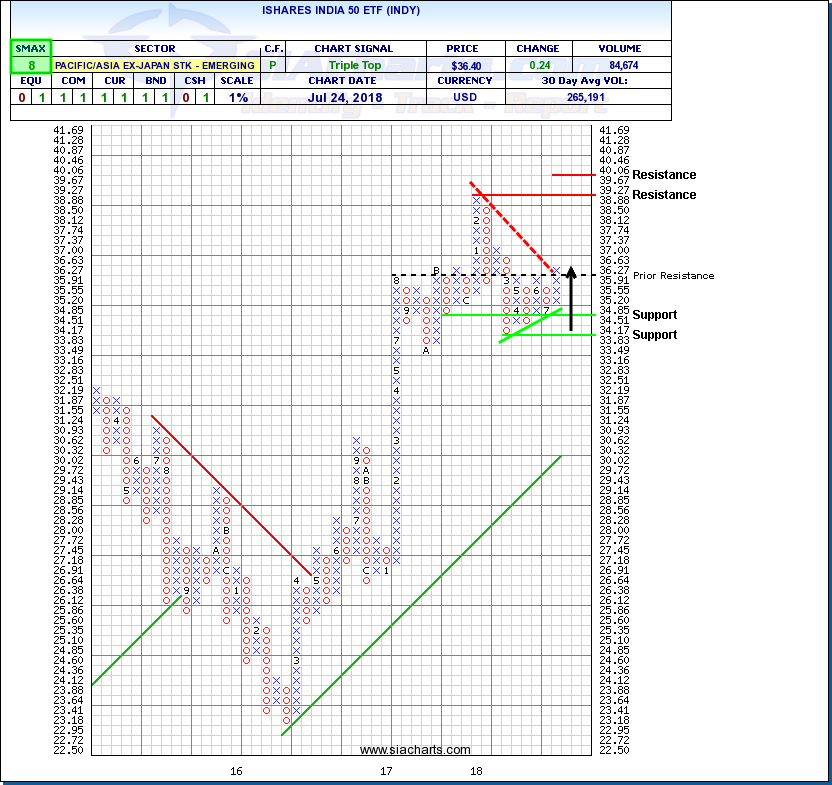
iShares India 50 ETF (INDY)
A number of emerging markets have struggled in recent months, but in many cases, weakness has been primarily due to falling commodity prices or the growing risk that tariffs, or other trade measures, could curtail exports of raw materials and manufactured goods to the US.
India, on the other hand, is not a big producer of raw materials for export and much of the international trade that India does conduct is in services, which so far have not been impacted by trade disputes.
The iShares India 50 ETF, which tracks the Nifty Fifty has come under renewed accumulation and appears to be breaking out of a base. Higher lows of O columns have been indicating increasing support for several months. The breakout over $36.27 completed a bullish Triple Top pattern signalling the start of a new uptrend that would be confirmed by a break through $36.63 that would call off a downtrend. Initial upside resistance may appear at the previous high near $39.27, or $40.06 based on a horizontal count from the Triple Top. Initial support appears near $34.51.
With an SMAX score of 8, INDY is exhibiting near-term strength against the asset classes.
SIACharts.com specifically represents that it does not give investment advice or advocate the purchase or sale of any security or investment. None of the information contained in this website or document constitutes an offer to sell or the solicitation of an offer to buy any security or other investment or an offer to provide investment services of any kind. Neither SIACharts.com (FundCharts Inc.) nor its third party content providers shall be liable for any errors, inaccuracies or delays in content, or for any actions taken in reliance thereon.
Copyright © SIACharts.com