


by John Lynch, Chief Investment Strategist, LPL Research
KEY TAKEAWAYS
- We forecast 10% returns or higher for the S&P 500 Index in 2018, but a pickup in volatility.
- We believe the S&P 500 is well positioned to generate strong earnings, thanks to a combination of steady economic growth and benefits of the new tax law.
- The profit story remains a global one, although earnings growth expectations are not as strong for developed international.
The current environment looks favorable for strong earnings and stock gains. We do expect volatility, but steady economic growth provides a strong backdrop and the potential for opportunity.
The first half of 2018 saw the return of equity volatility after the docile trading patterns of 2017. The surge in bond yields after the January jobs report, along with the initial trade concerns in late March, resulted in the first market corrections (a pullback of at least 10.0%) since the Brexit vote in June 2016. Though higher bond yields caused market disruptions, rising market interest rates (especially from relatively low levels) have typically been associated with an improving economy and higher stock prices. As a result, when viewing market volatility in the context of steady economic growth, it is not something to fear, in our opinion, but to embrace, as temporary market sell-offs may provide suitable investors with opportunities to rebalance portfolios toward long-term targets.
Given that the Fed is well on its way to unwinding accomodative measures, we encourage investors to focus on the fiscal tailwinds of favorable taxes, regulation, and government spending, while identifying companies that are willing and able to take advantage of these developments.
Please see our Midyear Outlook 2018: The Plot Thickens publication for insights on the economy, stock and bond markets, and investments for the year ahead. This week’s commentary features content from that publication.
Midterm Elections: The Next Market Challenge?
Throughout the increased volatility in the first half of the year, we’ve emphasized to investors that “bottoming is a process.” In other words, when the market does experience a correction, even as the catalysts for that decline dissipate, the recoveries can still take several months. We saw this in 2011 and 2015, and this year has been no exception. The second half of the year will also likely see the added potential headwind of midterm elections, which have historically provided the most volatility within the four-year presidential election cycle.

Because the president’s party typically loses approximately 25 House seats, investors have historically struggled with the policy uncertainty leading up to midterm elections. The good news is that stocks tend to bounce back strongly after midterm election year corrections, as the average decline (-16.0%) has been followed by a solid recovery from the trough (+32.0%) over the ensuing 12 months [Figure 1].
The Strength to Persevere
We also believe that during volatile periods, investors should focus on positive fundamentals like the strength in corporate profits. In the first quarter of 2018, S&P 500 Index companies’ earnings per share (EPS) came in well ahead of expectations. Given this development, we have decided to slightly upgrade our operating earnings forecast from $152.50 to $155.00 per share for the S&P 500, which would represent approximately 17.0% year-over-year growth.
Our forecast is still below consensus expectations and may prove conservative given the substantial impact of the transition to fiscal leadership. However, we remain cautious due to several ongoing factors that could affect earnings:
- A stronger U.S. dollar would affect the EPS currency translation for multinational companies.
- Geopolitical risks and trade tensions may hinder capital spending.
- Wage increases could negatively impact companies’ profit margins.
Based on our earnings forecast (of $155 EPS), our fair value projection is for the S&P 500 to trade within the range of 2900–3000 by year-end, which at the midpoint represents an annual increase in excess of 10.0% for the index and a target price-to-earnings (PE) ratio of 19. A PE of 19 is slightly above its historical average; however, when put in the context of still relatively low interest rates and low inflation, we believe a PE at this level is justified.
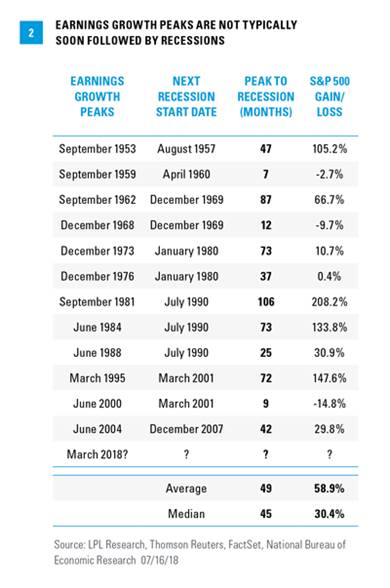
Earnings Have Climbed to the Top
Another concern for investors that has recently surfaced is whether the recent first quarter earnings season would prove to be “as good as it gets.” Despite widespread discussion of “peak profits,” the first quarter EPS growth of more than 25% year over year does not necessarily mean trouble is imminent—even if it were to be the percentage EPS growth peak in this cycle. In fact, a look back at six decades of earnings growth peaks suggests that it typically takes about four years from a profit growth peak before the economy slips into recession [Figure 2]. It is noteworthy that the S&P 500 gained an average of 59% during these periods between earnings growth peaks and the start of the next recession.
Developed International May Be the Weak Link
The profit story remains a global one, although earnings growth expectations are not as strong in developed international markets. A combination of slower economic activity (Japan) and political disruptions (Europe) have weighed on investor sentiment. We also remain concerned about government debt levels, and the potential for continued political uncertainty has led us to prefer U.S. and emerging markets.
Though emerging markets have been pressured by a combination of rising interest rates, U.S. dollar strength, and fears of a trade war, we continue to believe that advantageous demographics, early cycle acceleration, and commodities gains will ultimately benefit the group. This positive economic outlook is translating to a strong earnings growth outlook, with consensus estimates showing an expectation of approximately 14.0% EPS growth, while valuations remain attractive. Trade remains a key risk for emerging market nations, especially China and Mexico, which could continue to pressure their stocks in the near term.
Can Stocks Prevail in the End?
In the spirit of embracing volatility, we recommend that suitable investors take advantage of periodic weakness to invest excess cash or rebalance portfolios back toward targeted long-term allocations. The fundamentals supporting economic growth and corporate profits remain solid from our perspective, and we’ll continue to position portfolios toward beneficiaries of the transition from monetary to fiscal leadership.
As a result, we continue to favor small caps over their large cap counterparts, primarily because of the new tax law, trade policy, and a potentially stronger U.S. dollar. Small cap companies generally had higher taxes, so they benefit more from the reduction in corporate rates. With less overseas revenue, small cap companies are not impacted as much by tariffs and the stronger dollar is less of a drag, compared with large caps.
Though the growth style of investing has maintained momentum, we continue to see attractive valuations on the value side and a fair amount of cyclical value stocks that we think will benefit from the return of the business cycle. Value stocks have historically performed better when economic growth accelerates, a condition that is in place today. We believe the financials sector is well positioned given lower taxes, deregulation, higher interest rates, and attractive valuations. Industrials should prosper given capital investment growth, immediate expensing opportunities, and solid global growth. Technology should also maintain momentum, which can be justified by lower taxes and higher business investment.
Finally, we continue to favor emerging market stocks over developed international for the reasons we described earlier. While we expect volatility to persist, we also believe that it represents an opportunity for investors as the economic and profit cycle persists.
Overall, earnings growth may have peaked and volatility may stay with us. But we see enough growth in the economy and corporate profits to potentially carry stocks to further gains in the second half of 2018.
*****
IMPORTANT DISCLOSURES
The opinions voiced in this material are for general information only and are not intended to provide specific advice or recommendations for any individual. To determine which investment(s) may be appropriate for you, consult your financial advisor prior to investing. All performance referenced is historical and is no guarantee of future results.
The economic forecasts set forth in the presentation may not develop as predicted and there can be no guarantee that strategies promoted will be successful.
Investing in stock includes numerous specific risks including: the fluctuation of dividend, loss of principal, and potential liquidity of the investment in a falling market.
Because of its narrow focus, specialty sector investing, such as healthcare, financials, or energy, will be subject to greater volatility than investing more broadly across many sectors and companies.
The prices of small cap stocks are generally more volatile than large cap stocks.
Value investments can perform differently from the market as a whole. They can remain undervalued by the market for long periods of time.
Investing in foreign and emerging markets securities involves special additional risks. These risks include, but are not limited to, currency risk, geopolitical risk, and risk associated with varying accounting standards. Investing in emerging markets may accentuate these risks.
Rebalancing a portfolio may cause investors to incur tax liabilities and/or transaction costs and does not assure a profit or protect against a loss.
All investing involves risk including loss of principal.
All indexes are unmanaged and cannot be invested into directly. Unmanaged index returns do not reflect fees, expenses, or sales charges. Index performance is not indicative of the performance of any investment.
INDEX DESCRIPTIONS
The Standard & Poor’s 500 Index is a capitalization-weighted index of 500 stocks designed to measure performance of the broad domestic economy through changes in the aggregate market value of 500 stocks representing all major industries.
DEFINITIONS
Earnings per share (EPS) is the portion of a company’s profit allocated to each outstanding share of common stock. EPS serves as an indicator of a company’s profitability. Earnings per share is generally considered to be the single most important variable in determining a share’s price. It is also a major component used to calculate the price-to-earnings valuation ratio.
The PE ratio (price-to-earnings ratio) is a measure of the price paid for a share relative to the annual net income or profit earned by the firm per share. It is a financial ratio used for valuation: a higher PE ratio means that investors are paying more for each unit of net income, so the stock is more expensive compared to one with lower PE ratio.
Copyright © LPL Research