By Brad McMillan, CFA®, CAIA, MAI, chief investment officer, managing principal, Commonwealth Financial Network®
2017 was a great year for the economy and financial markets, and we started 2018 with high hopes for even faster growth and continued market gains. But between the stock market pullback early in the year; the slowdown in economic growth; and the rising political risks in Asia, with North Korea, and in Europe, with Britain and Italy, expectations softened. Perhaps 2017 was the end of the cycle after all.
As we approach the middle of the year, however, those initial hopes once again seem to be realistic. According to the data, job growth has actually accelerated in 2018, bringing us, essentially, to full employment. Wage growth is close to its highest levels since the crisis, which is providing consumers with the ability—and willingness—to spend. Business confidence is elevated, and business investment is accelerating. Government has moved from a headwind to a tailwind, as tax cuts and fiscal stimulus have combined to create the most supportive environment we’ve seen in years.
By the Numbers: 2018 Forecast
- GDP Growth: 3%
- Inflation: 2%
- Federal Funds Rate: 2.25%–2.50%
- 10-Year U.S. Treasury Yield: 3.50%
- S&P 500 Index: 3,000
We now find ourselves in what can reasonably be called a successful, growing economy. We are back to what we like to think of as normal. As we look into the second half of 2018, I believe that the economy will continue to grow, with healthy employment conditions, rising interest rates, and the reasonable prospect of rising markets. I expect growth to accelerate from first-quarter levels to levels closer to what prevailed in the 1990s and 2000s—in other words, normal. This growth will be fueled by the following:
Employment—which is likely to continue to grow, albeit at potentially slower levels than in the first half of the year
Businesses—which should keep increasing their investment, as capacity utilization rises and labor becomes scarcer
Government spending—which should revert to a growth pattern, now that the tax cuts and spending deal are in place
All things considered, I expect to see real economic growth of around 3 percent, with the possibility of stronger results. With consumer spending growing at around 3 percent, business investment potentially growing at around 5 percent, and government spending showing slow growth around 2 percent, this 3-percent figure appears both reasonable and achievable. Combined with inflation of around 2 percent for the year, nominal growth should approach 5 percent.
Risks: Both Upside and Downside
What could get in the way of these anticipated results—or lead us to surpass them?
For the economy. On the upside, if wage growth increases, consumer spending power could increase even more. If consumer borrowing were to pick up, that would also support faster spending growth. Business investment, likewise, could respond to improving demand and rise more than expected. Local and state governments could increase investment and hiring more than expected.
On the downside, the risks are primarily political. Here in the U.S., the midterm elections will certainly disrupt the political process and raise substantial economic uncertainties if it appears that Democrats might take one or both houses of Congress. In the nearer term, the Trump administration’s trade policies have the potential both to disrupt supply chains and increase costs, which would certainly affect financial markets. Abroad, changing U.S. policies (including monetary policy) will continue to rattle the world. In Asia, the implementation of the recent agreement with North Korea will continue to drive headlines. Meanwhile, the ongoing Brexit process and European political turmoil, particularly with Italy’s government imbroglio, have the potential to increase risks.
The other major domestic downside risk involves the effects of rising interest rates. In its June press conference, the Federal Reserve (Fed) more or less declared victory on both employment and inflation, which means it is now likely to raise rates faster than had been anticipated. Expectations are for at least two more increases in 2018. With long-term rates still constrained, this would raise the risk of a yield curve inversion, which historically has been a harbinger of recession. The Fed is aware of this, however, so rate increases are likely to remain slow to support continued economic expansion.
For the stock market, the rest of the year could be quite exciting, in both a positive and a negative sense. I expect the U.S. equity markets to end the year with moderate appreciation from levels at the end of December—around 3,000 for the S&P 500 as a base case. On a relative basis, earnings growth should continue to improve on the heels of tax reform and economic expansion. Assuming no further shocks from North Korea or Italy, valuations may well rise back to previous highs.
There are certainly risks to the market on the downside. Valuations remain at or above the high levels of 2007. Profit margins are also at historic highs, and the tailwinds that got them there are disappearing due to rising interest rates and wage growth. With the expected rise in interest rates, bonds may become a more attractive investment, which would lower the present value of the earnings stream even more. Absent the Fed’s security blanket, the market should be more volatile, and I believe it will be.
That said, there are also upside risks. With faster growth and rising consumer confidence, any shift in investor sentiment could drive prices even higher. This “bubble effect” would take valuations even farther above historic norms. Although this could certainly happen in 2018, it would only set the stage for a more severe adjustment later on.
Now that we understand the big picture, let’s review the particulars in more depth. The following commentary will consider the economy and markets separately; although they are linked, they respond differently to the underlying supply-and-demand factors.
How the Economy’s 4 Pillars Will Affect Growth
The economy is made up of consumer spending, business investment, government spending and investment, and net exports. By examining each component individually—looking at real growth and then factoring in inflation—we can better understand where growth is expected to come from and why.
1) Consumer Spending
Consumer spending represents about 70 percent of the economy and is the single most important determinant of growth. It is composed of wage income, transfer income, investment income, and borrowing. Wages are the largest component of income, at just less than two-thirds, and the only income source for most families. Wages are also the most variable source of income.
Growth in wage income depends on three factors:
- Growth in the number of jobs
- Hours worked at each job
- Average pay for each hour worked
For example, even if the number of jobs remains the same, if each worker works longer hours and/or wages per hour increase, then wage income can rise. This scenario is largely what we saw in the early part of the recovery, but now the data suggests that all three factors are improving.
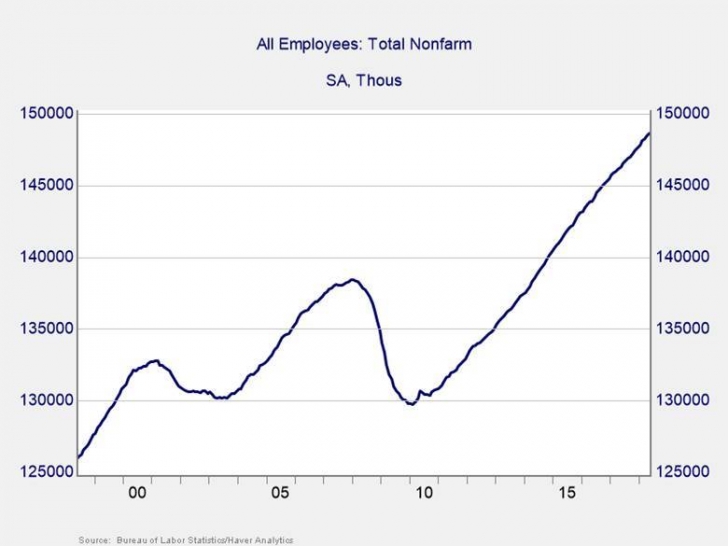
Number of jobs. The number of jobs has recovered to a new high, as shown in the following chart. Note that there are now about 10 million more jobs than there were before the financial crisis—a larger increase than we saw from 2000 to 2007, which speaks to both the severity of the financial crisis as well as the magnitude of the recovery.
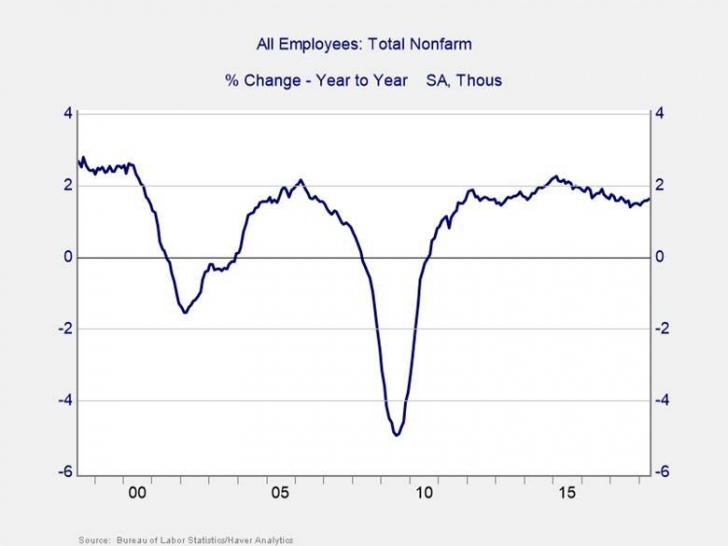
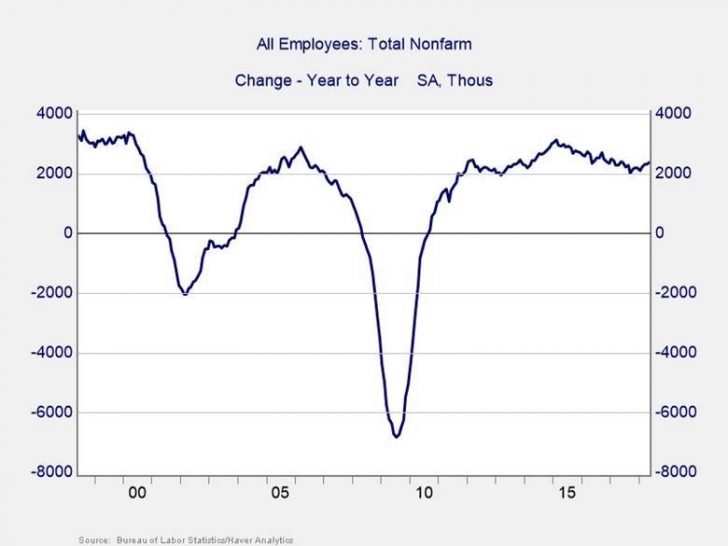
Job growth. In fact, after declining through 2017, the annual job growth rate has started to accelerate, taking it close to the peak levels of the mid-2000s. This is also consistent with the absolute number of jobs created; job creation remains above 2 million and has stayed in this range for a longer period than it did in the mid-2000s. (The following two charts illustrate these numbers.) Job growth has been a substantial contributor to both confidence and income growth. Despite a growing labor shortage, this is likely to continue through the balance of 2018.
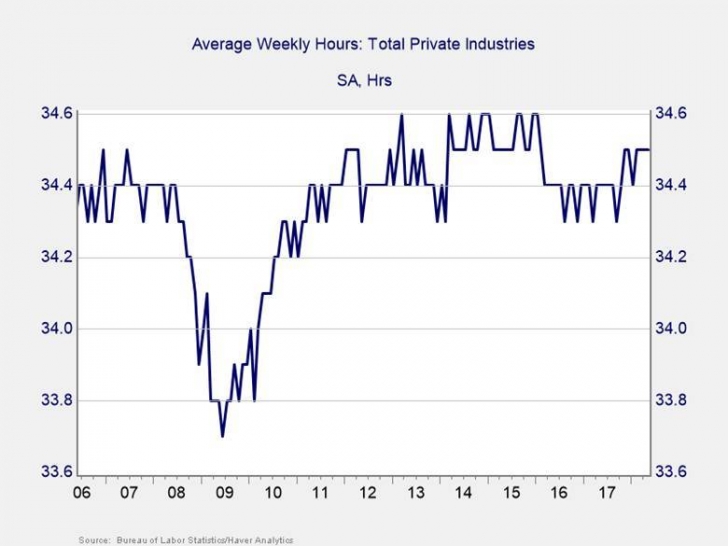
Aggregate labor demand. Beyond the number of jobs, we must also consider how much each worker is able to work. The following chart shows that average weekly hours worked at each job have recovered to the levels of the mid-2000s. Even with the large number of jobs created, labor demand remains strong.
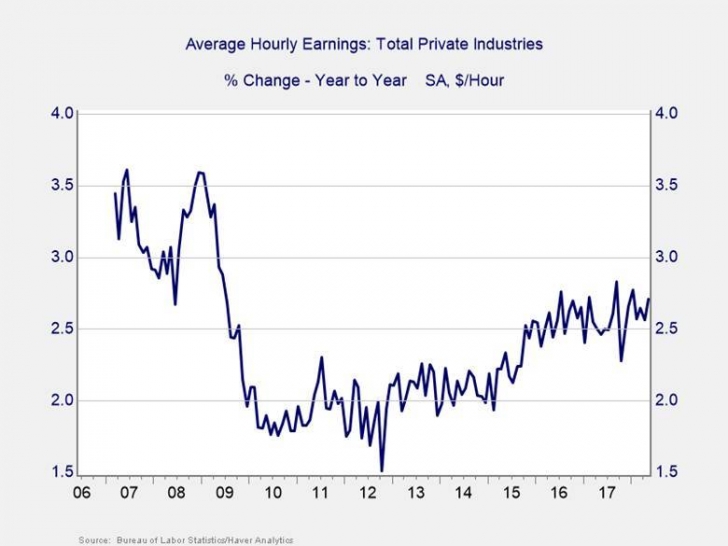
Wage growth. Another way to look at the health of the labor market is to examine how much workers are being paid. In a tightening labor market, you would expect wage growth to rise. The evidence here is mixed: average wage growth stabilized in 2017, consistent with the slowdown in job growth at the time. Wages, however, are not the most inclusive measure of compensation, and other measures are rising more quickly. Hourly wage growth also does not take into consideration a longer work week.
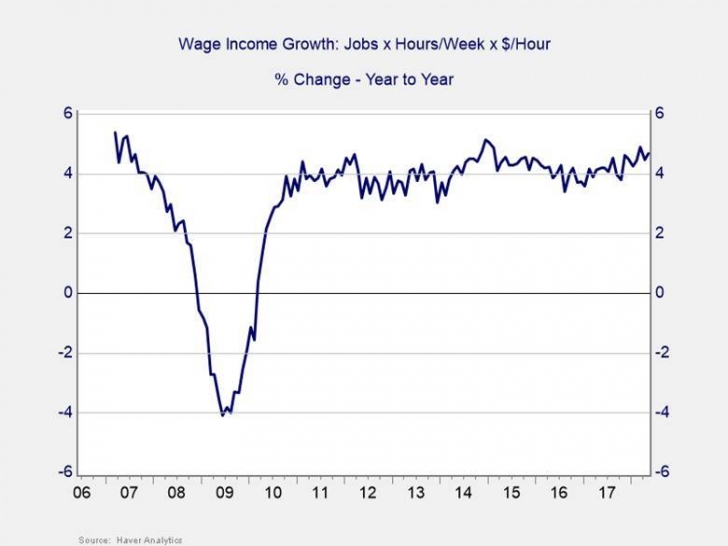
Wage income growth. When we incorporate these additional factors, we can calculate wage income growth as a better indicator of consumer income. Per the following chart, wage income growth has accelerated from 2016 to the present and has consistently averaged between 4 percent and 5 percent per year since mid-2010. (Note that, as the chart shows only private employment, effective wage growth would be somewhat lower.)
Keep in mind that these figures do not consider the effects of inflation. Subtracting the likely 2-percent increase in the Consumer Price Index suggests that, on a real basis, wage income growth has been about 3 percent over the past year.
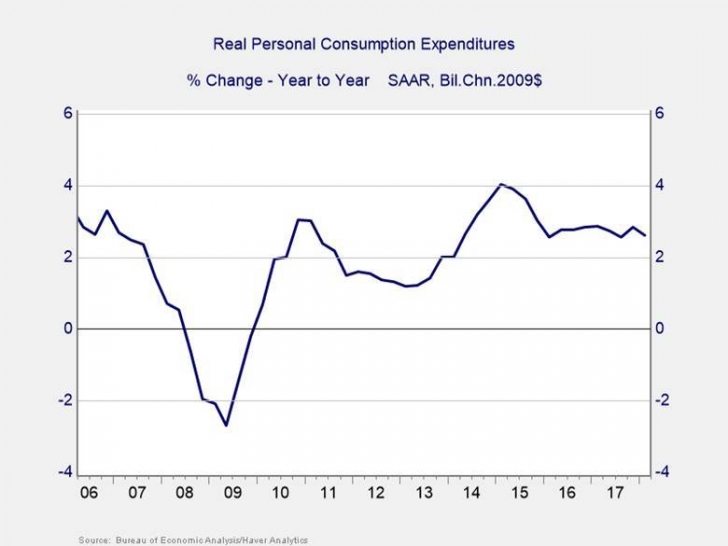
What about consumer spending growth? Let’s look at that next. On a real basis, per the following chart, growth in consumer spending has run between 3 percent and 5 percent, holding steady at around 3 percent in the past year or so after declining from mid-2015. This is in line with wage income growth.
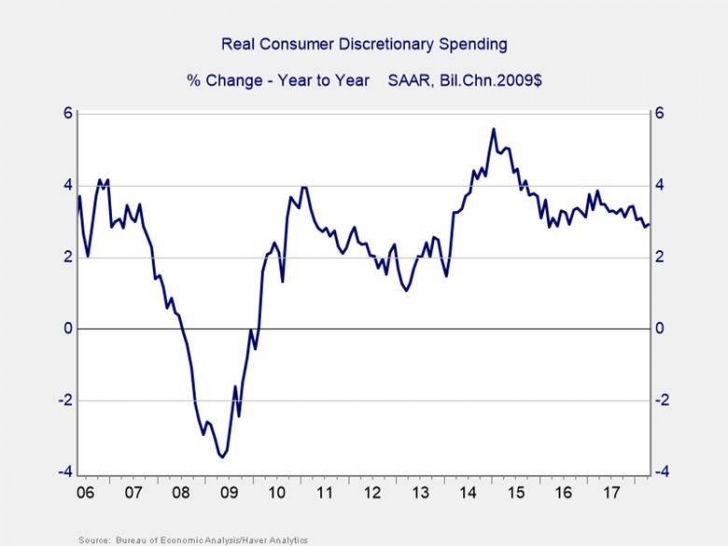
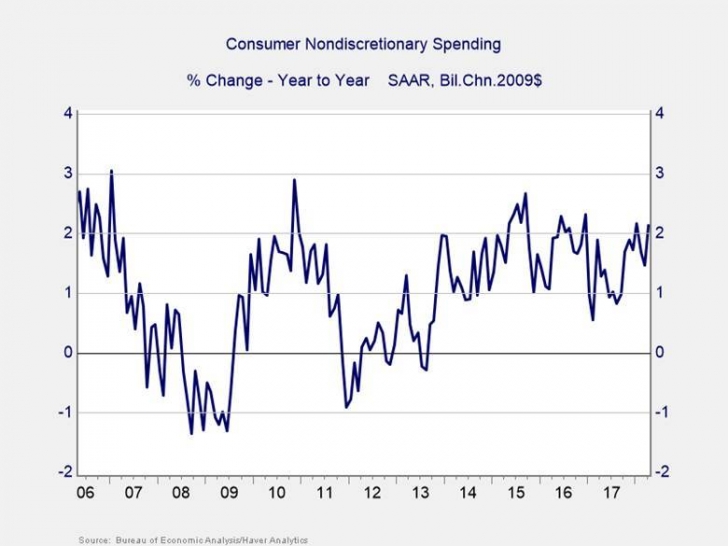
When we break down consumer spending, we find that growth in discretionary spending has been around 3 percent, consistent with wage income growth. Nondiscretionary spending growth, on the other hand, has been much lower, around 2 percent. Because nondiscretionary spending is for things we need (e.g., toilet paper), this smaller increase makes sense. When their incomes go up, few people buy more toilet paper than necessary, although they may spend a bit more on higher-quality goods.
When it comes to consumer spending growth numbers, we have certainly seen a reversal of the downward trend in 2016 and early 2017. This appears to be related to the recovery in consumer confidence and job growth, as well as the recovery from the stock market pullback in early 2016. As of mid-2018, job growth remains strong, wage income growth is rising, and the stock market remains close to its highs. With solid fundamentals and rising consumer confidence, there is a significant chance that future spending growth will be higher.
Therefore, a growth rate in consumer spending of around 3 percent on a real basis seems reasonable. Adding in inflation of around 2 percent, we can estimate a nominal growth rate of 5 percent for the year.
2) Business Investment
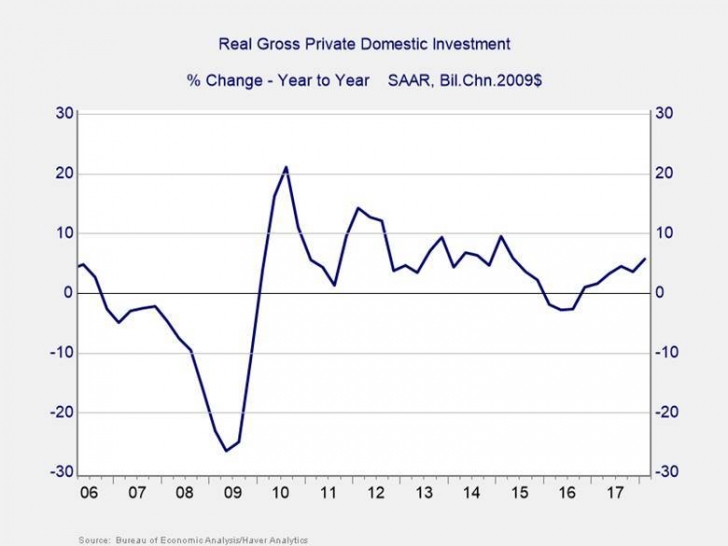
Unlike consumer spending, business investment has not shown consistent growth. In fact, after bouncing around between 5 percent and 10 percent from 2012 through 2014, it dropped through 2015 and 2016. Since then, however, business investment has trended higher, reaching levels typical of most of the recovery. One of the big questions for the rest of 2018 is whether business investment will accelerate even more.
In an effort to determine the answer, we can look at the following major components of business investment:
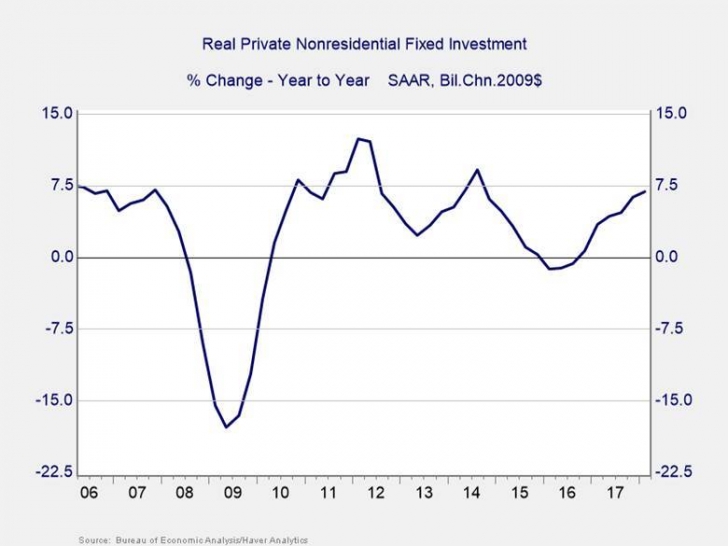
Nonresidential fixed investment. Investment in commercial structures and equipment, after dropping in 2015 and early 2016, has recently returned to growth levels consistent with those of the mid-2000s.
Given this acceleration, the effects of the Tax Cuts and Jobs Act, and a growing labor shortage, it seems likely that nonresidential fixed investment will continue to add meaningfully to 2018 growth.
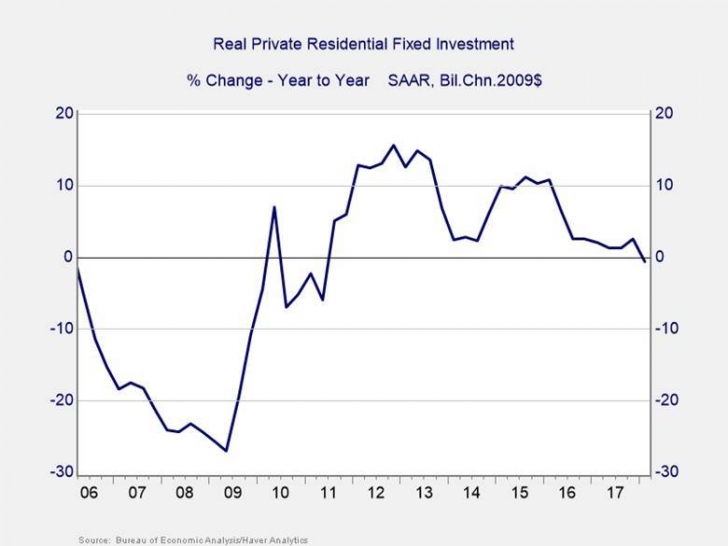
Residential fixed investment. Residential investment, on the other hand, has declined and is unlikely to add to economic growth.
With the housing market chugging along—and recent data showing positive developments overall—a return to growth would at least help at the margins. Given current trends, however, any positive contribution from this area in 2018 is likely to be small.
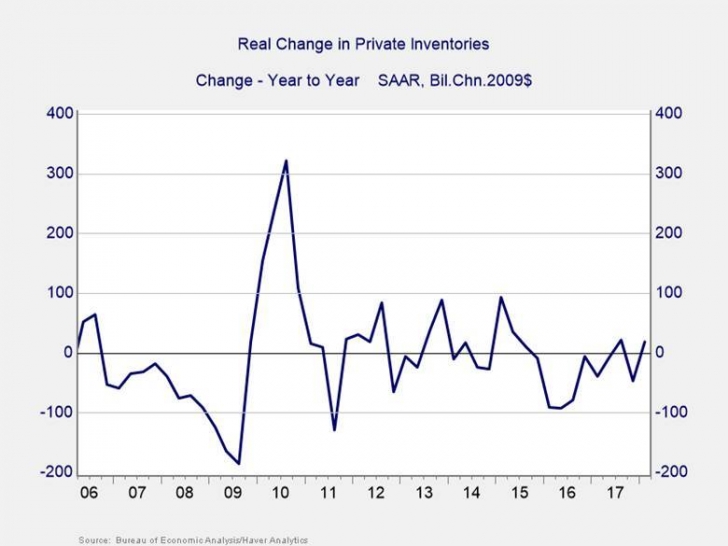
Private inventories. Finally, inventories, which have detracted from growth in recent years, are bouncing back.
That said, although there may be some potential for additional growth here, as inventories are rebuilt, it is likely to be relatively small and short lived.
Business investment growth was one of the key shortfalls of 2016 and the early part of 2017, but the evidence today suggests that it is likely to contribute significantly to growth through the remainder of 2018, despite constraints from the lack of growth in residential investment and inventories.
There are three factors that support this acceleration:
- Economic and political uncertainty continues to decrease.
- The unemployment rate has returned to normal levels.
- Wage income growth appears to be growing at a faster rate, making increased consumer demand more likely than it has been for years.
As illustrated in the following chart, business investment has tended to have a high negative correlation with uncertainty. In other words, business investment rises (with a lag) as uncertainty declines. Here, you can see that uncertainty, as measured by this index, which includes both policy and economic issues, is indeed declining overall, and this could lead to faster investment growth in the next couple of quarters.
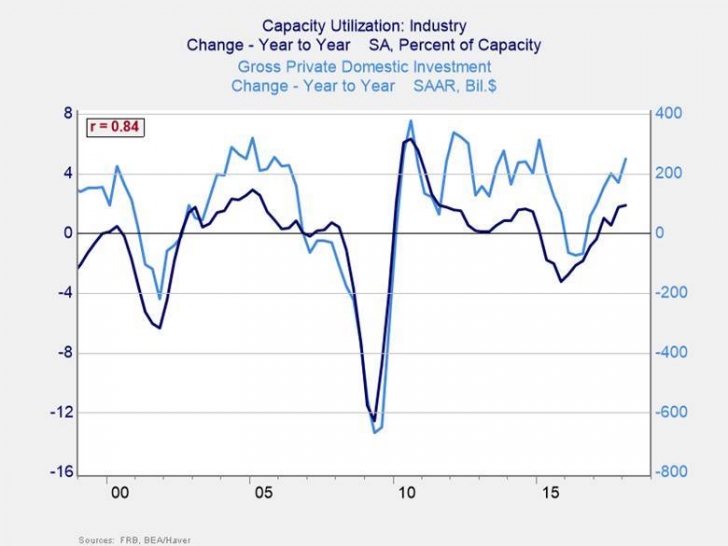
In addition, existing facilities are being worked hard enough to warrant new investment. After the downtrend through 2015 and into 2016, the uptick in capacity utilization is encouraging.
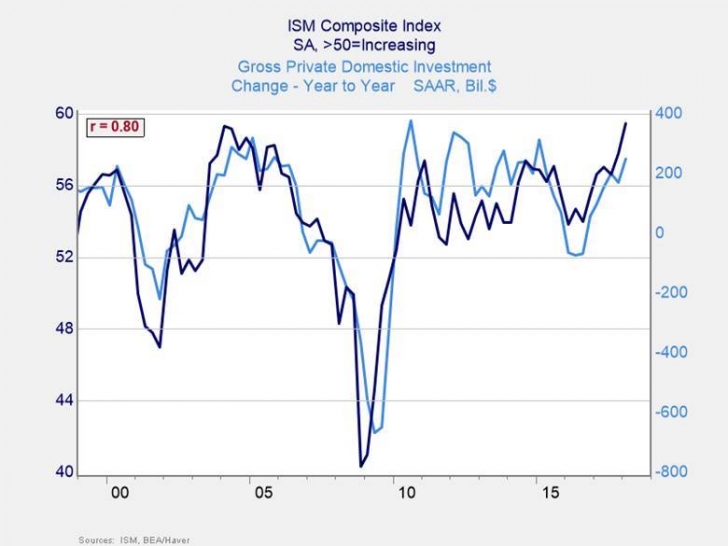
Further, given the reduction in uncertainty and the rise in capacity utilization, business expectations have also reached a point that has historically been associated with a higher level of business investment. The Institute for Supply Management (ISM) business expectations survey is highly correlated with investment—and it is in positive territory.
Beyond the macro fundamentals, there are other reasons to expect improvement. The energy industry continues to expand on rising oil prices. Housing demand also remains strong, suggesting that residential investment could become additive again.
There is substantial downside risk, however. The dollar’s recent decline, which positively affected U.S. manufacturing, has started to rise, which may constrain capital investment. Also, while U.S. economic performance is healthy, the rest of the world is showing signs of slowing, so we may see decreased investment unless major economies abroad also accelerate.
Looking at all of the evidence, I expect business investment to grow at an annual rate of around 5 percent through the balance of 2018. This projection reflects expected faster domestic growth, as tempered by weakness elsewhere in the world, along with dollar strength, which stands to adversely affect manufacturing and exports. Adding inflation of 2 percent gives us expected nominal growth of 7 percent.
3) Government Spending
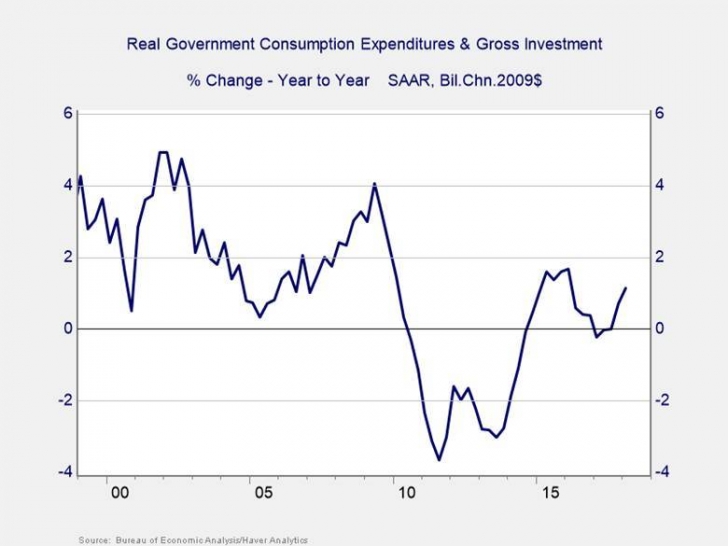
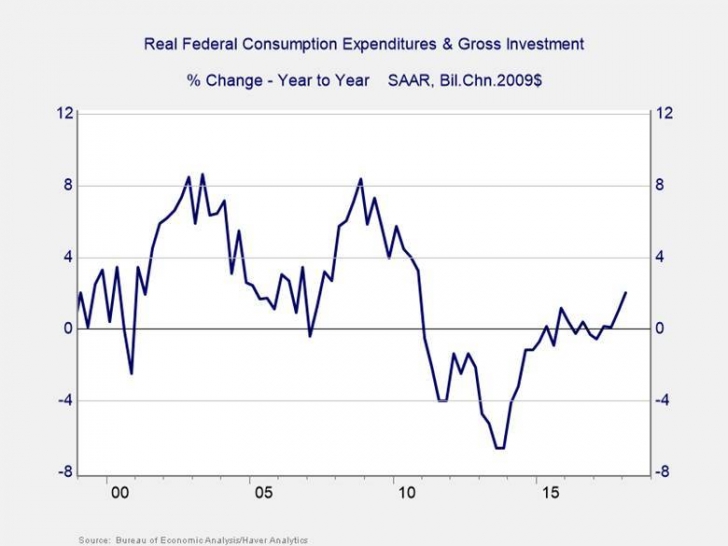
From 2011 through 2014, cuts in government spending due to the budget sequestration—imposed in response to the fiscal cliff confrontation—created a drag on economic growth. While government spending has contributed to growth over the past couple of years, it has increased into 2018 on the Republican Congress’s decision to raise spending significantly.
Can we expect this trend to continue through the second half of 2018? If so, by how much? To answer these questions, we need to look separately at the federal and state/local levels, as they are subject to different constraints.
At the federal level, on a real basis, overall spending has been increasing slowly over 2017 and into 2018. That trend is likely to continue, given the aforementioned budget spending agreement.
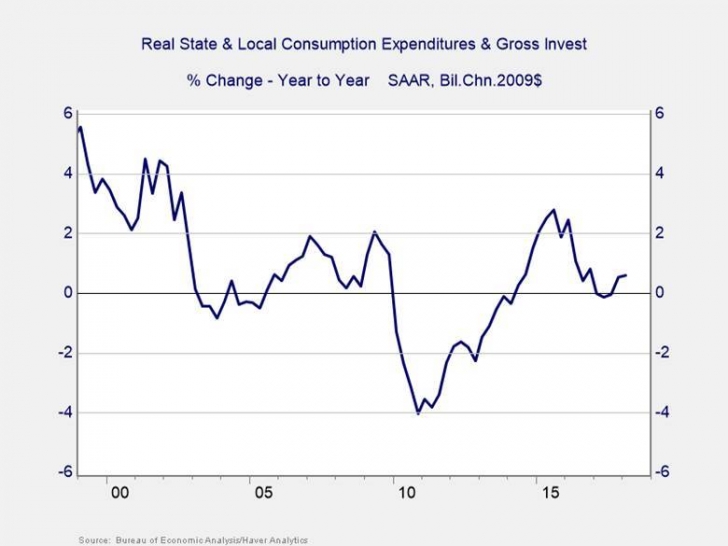
State and local spending, however, has dropped from a growth level of between 3 percent and 4 percent to less than 1 percent, which will constrain total government spending growth.
As the economic recovery is anticipated to continue through 2018, I expect a sustained level of spending growth of around 2 percent at both levels, combined. This reflects the net of the low spending at the state/local level and the probable additional spending at the federal level under the Trump administration. Adding an expected inflation rate of around 2 percent should result in nominal spending growth of approximately 4 percent.
4) Net Exports
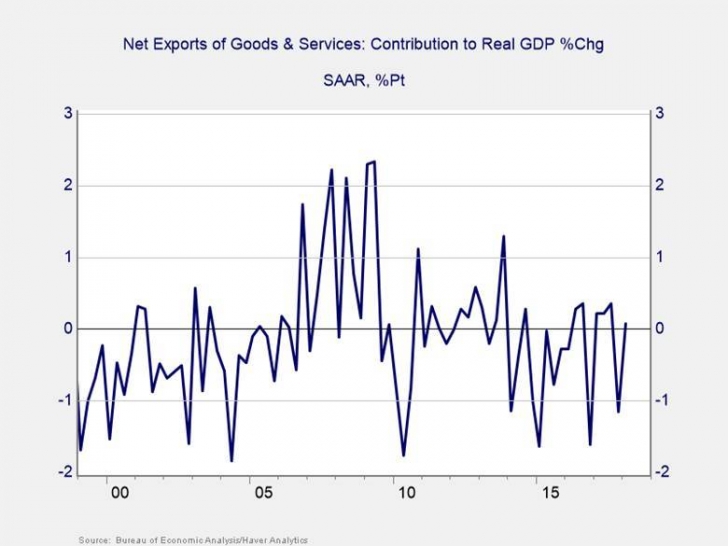
The final component of the economy, net exports, is not likely to add significantly to economic growth in 2018, as illustrated in the following chart.
In 2016, despite the strong dollar, net exports had an additive effect, but this trend reversed in 2017 as imports rose. Given the volatility, and despite the current growth in exports, the likelihood that net exports will either subtract from or add to growth is low.
What Does This Mean for Real Economic Growth?
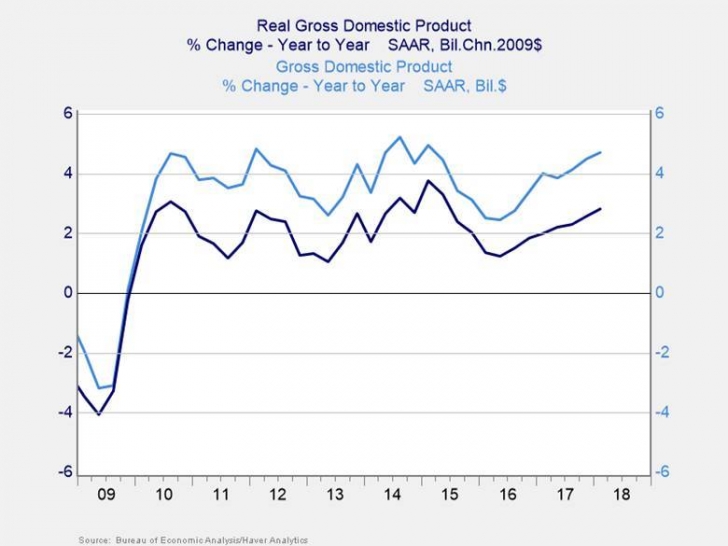
Based on the factors discussed above, we should expect to see real growth in the 2.75-percent to 3.25-percent range for the balance of 2018. I am leaning toward the higher end of this range, given the potential upside in several of the components at midyear.
With inflation estimated at approximately 2 percent, this equates to nominal growth of around 5 percent.
This is a healthy growth rate—close to the highest level since the financial crisis—but it’s still slower than in past recoveries. It should result in continued growth in employment and wage income. Supporting forces here include strong job creation, tax cuts and increased government spending, a moderating but ongoing housing recovery, and increasing wage growth. Risk factors include political turbulence in Europe, growth declines in China and Japan, and possible financial turbulence as the Fed continues to raise rates.
Market Projections for Fixed Income and Equities
Fixed Income
As of mid-2018, the Fed has raised the federal funds rate two times this year. In theory, the rate increases mean two things:
- The economy is improving and, in the Fed’s judgment, needs less support.
- Interest rates are likely to increase as the Fed continues to normalize policy.
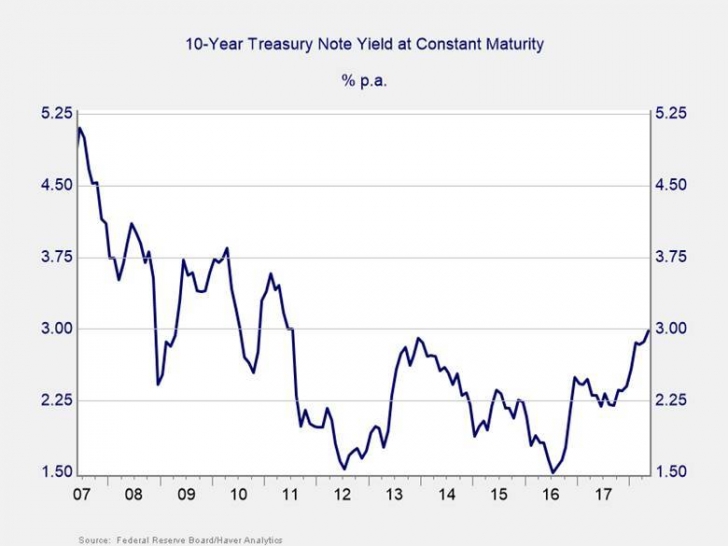
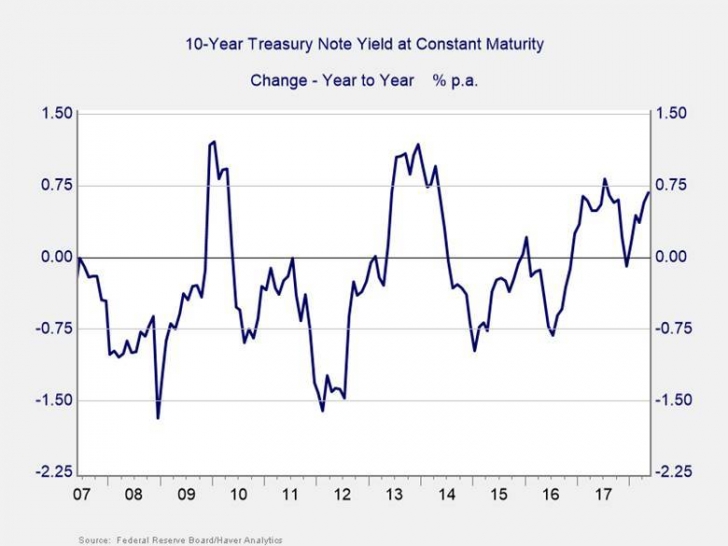
Despite expectations that the Fed will increase rates gradually, interest rates recently spiked as investors worldwide began to anticipate both higher growth and inflation in the US. That said, rates are back only to levels of late 2013, so there’s room for additional increases. This is further supported by the Fed’s express plans to keep raising rates in the face of rising inflation. The Fed will be constrained, however, by strong demand for U.S. securities from abroad, where interest rates are even lower. It’s possible this constraint could fade, as the European Central Bank has started to hint at dialing down its economic stimulus programs, which have held rates down in other parts of the world.
The Fed’s projections currently indicate at least two more rate increases in the balance of 2018, and market expectations are consistent with this as well. It’s possible, however, that the Fed could accelerate the pace of increases, particularly if economic growth and demand from other nations rise. While U.S. rates are higher than those elsewhere, making U.S. fixed income a very attractive investment for international borrowers (especially at the longer end of the curve), the major foreign buyers may dial down their purchasing of U.S. assets on growing trade conflicts, which could move interest rates higher than they would have been otherwise.
Overall, I expect interest rates to continue to rise through 2018, in response to the expected Fed actions, with the 10-year U.S. Treasury bond ending the year at about 3.5 percent. This assessment takes into account the fact that other countries may shrink their stimulus programs faster than we now expect.
We are likely to see periods of both rising and falling rates, but the overall steady increase in interest rates will give markets time to adjust. With rates still low by historical standards, a focus on credit, such as corporate bonds, should continue to provide incremental returns, even though spreads are compressed.
The U.S. Stock Market
Three key variables are at work in the equity markets:
- The growth rate of the economy as a whole, which will determine corporate revenue
- The level and change in profit margins, which, together with the overall economic growth rate, will determine corporate earnings growth
- The level of price multiples—or how much investors will pay for a given level of earnings
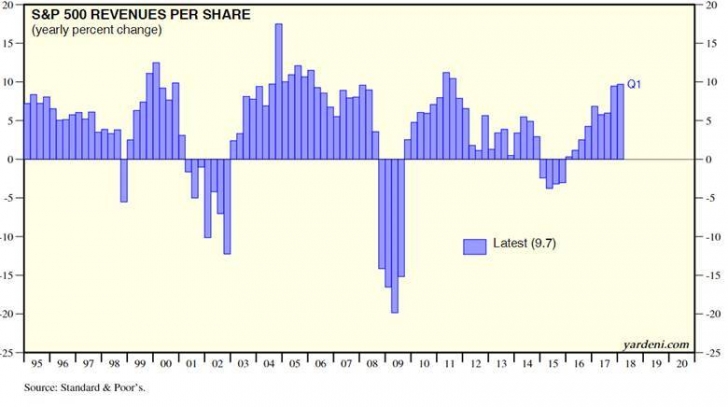
Corporate revenue. As stated above, I expect U.S. growth to be in the 5-percent range on a nominal basis for 2017. Much of this will come from growth in consumer spending. But business investment will also contribute, and government should continue adding incremental growth.
Aggregate corporate revenue grows over time at the rate of GDP growth, although there are periods in which revenues decline, as was seen in 2015 (per the following chart). Since then, however, revenue growth has resumed at levels consistent with economic growth as a whole.
Prospects for the last quarters of 2018 are likely healthy. We can reasonably estimate revenue growth at, say, 5 percent, to account for the growth in the economy. Using 5 percent seems reasonably fair, though it isn’t a slam dunk.
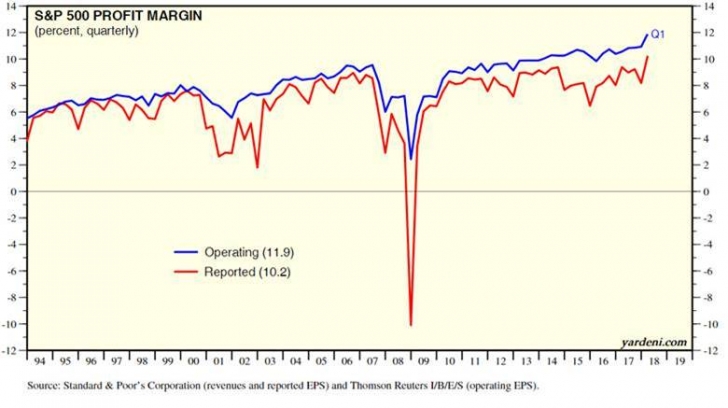
Profit margins. If nothing else changes, with revenue growth of 5 percent, we would also see corporate earnings growth of 4 percent to 5 percent, depending on how well the businesses are run (i.e., on their profit margins). But profit margins are now close to their all-time highs and no longer increasing, which may limit future improvement.
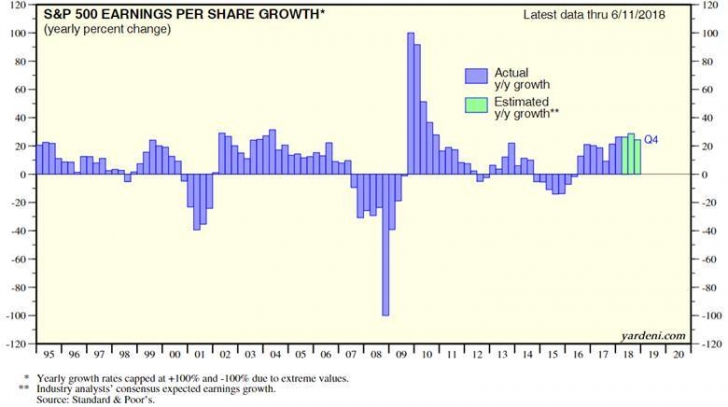
There are reasons to believe that margins might come down—rising wages being the most prominent—but increasing operating leverage as the economy improves may compensate for that. As shown in the following chart, investor expectations are for much faster EPS growth. In large part, this incorporates the savings from the recent tax reform bill, supported by share buybacks, which could be material for the rest of 2018 as companies repatriate foreign capital.
Expectations, however, often exceed actual results. While there is a possibility for upside earnings surprises, margins and share counts can reasonably be expected to stay around their current levels for 2018, and corporate earnings should grow by about 20 percent year-on-year. That growth, however, is largely due to the tax cut, so it will moderate in future years. Which brings us to the remaining question: how much will investors be willing to pay for those earnings?
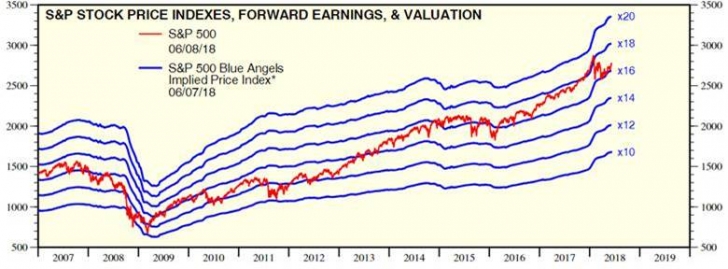
Valuations/Price multiples. Looking at the past five years, multiples for the S&P 500 have bounced between 10x and 18x forward earnings, only moving above the recent high of 15x, set in 2007, during the past couple of years. In 2018, valuations dropped to 16x at the start of the year on the expected tax cut, which buoyed earnings, but they have since moved back up a bit. With increasing growth and confidence, they may be poised to move even higher.
Following are reasons to believe that valuations could move higher:
- Sustained high levels even during the growth slowdown in 2017 and the recent pullback
- Accelerating economic and revenue growth
- Sustained demand for U.S. assets
- The surge in earnings growth (This is the most important.)
Valuations are driven largely by investor confidence and expectations, and these seem to be improving along with fundamentals.
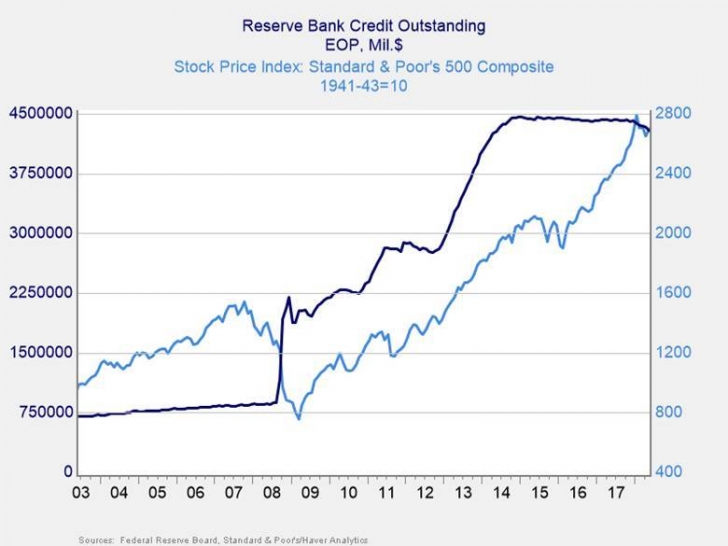
The Fed and the stock market. The Fed, on the other hand, suggests that valuations are more likely to move down than up. By signaling a continued but gradual increase in rates in 2018, the Fed has put markets on notice that it is slowly but steadily normalizing policy. As you can see in the following chart, S&P 500 performance has largely followed the Fed’s bond-purchasing program.
As financial conditions tighten, this may hamper index appreciation. And if the economy continues to strengthen, as I expect, the Fed will continue to raise rates during 2018 as well as accelerate the balance sheet drawdown. Markets typically anticipate the Fed’s actions, and the expectation of additional rate hikes will serve as another headwind.
Offsetting this, however, is the fact that rate increases are often a response to an improving economy—as I expect they will be this time. Historically, the initial round of rate increases has actually been positive for markets, as the faster growth and improving expectations offset the negative valuation effects of higher rates. The net effect of the Fed’s actions is therefore likely to be more positive than expected.
International Stock Markets
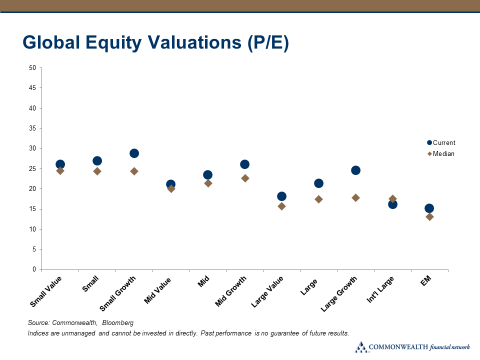
In 2017, as the Fed hiked rates and growth in the U.S. slowed, investor interest shifted from the U.S. to international markets. Now that the international central banks are considering pulling back on stimulus, growth is slowing, and political risks are rising, that trend has reversed. The U.S. markets have done much better than their international counterparts in 2018 to date. Adding to the concerns, valuations for developed international markets remain above their median levels, per the following chart.
Developed foreign markets are dominated by Europe and Japan, both of which have enacted quantitative-easing programs similar to the one the Fed has wrapped up. Just as U.S. markets responded to the Fed’s bond purchases by appreciating substantially, European and Japanese markets have done the same. With slowing growth and rising political risk in Europe, these markets warrant caution. Risks are likewise rising in Japan, which is largely trade dependent.
Emerging markets have suffered in 2018, as growth slowed around the world, the dollar strengthened, and rising oil prices hit many countries. It appears as if that damage may continue in the second half. In fact, comparing the valuations of U.S. and international markets, we see that the advantage is back with U.S. markets, at least in some sectors.
Valuations Are the Key
In light of my conclusions that the U.S. economy is in a sustainable recovery and that margins will likely remain around current levels, valuations are the key variable.
Valuations are typically based on the expected level of future growth, with investors willing to pay more for faster growth. For the S&P 500, anticipated future earnings growth for 2018 looks healthier than it has in some time, but the upside is limited. Market performance will ultimately depend on investor expectations as expressed in price-to-earnings multiples.
For most of the past three years, 15x forward earnings has been a typical lower-end multiple. Based on current analyst expectations for S&P 500 earnings of $176.52 in 2019, and using a 15x multiple, the 2018 year-end target for the index would be around 2,650—a decline of about 5 percent from mid-June 2018 levels. This would reflect a downward rerating of valuations and can therefore be considered a reasonable downside scenario for the end of the year.
If, however, the economy continues to accelerate, businesses continue to operate at very high profitability levels, and valuations rise to around 17x forward earnings, the S&P 500 could reasonably be expected to end 2018 around 3,000—an increase of almost 8 percent from current numbers.
Two factors could drive the market higher. First, headwinds could abate. If confidence improves, consumer spending growth could pick up, while business investment could accelerate even faster than it has. Governmental policy is also likely to continue to be helpful, between recent tax cuts, which should boost demand, and spending increases. All of these are quite possible.
Second, the economy could accelerate. Such an improvement could lead investors to become even more confident. As we have seen in the past couple of years, confidence swings can move multiples 1 to 2 points. There are upside risks here. If multiples rise to 18x, for example, the S&P 500 target would approach 3,200 for year-end 2018, representing a gain of almost 15 percent from midyear levels.
Overall, I suspect that the risks to the economic growth rate—and therefore to aggregate corporate earnings—are on the upside, while margins and valuations are also likely to increase slightly. The indicated target for the S&P 500, then, is at the upper end of the range, or 3,000.
While I suspect we’ll see appreciation, I believe that a sell-off at some point in the year is very possible, as investors reexamine their holdings and process the Fed’s rate increases. In addition, as rates rise, I also expect investors to reassess the attractiveness of U.S. stocks versus fixed income. Finally, I expect wage growth to accelerate, which should have a negative effect on profit margins, even as it boosts the economy as a whole.
Although risks remain, the U.S. and global economies continue to adjust in the face of shifting oil markets, credit markets, and political turmoil. The strength of the U.S. economy should protect us from the worst and even continue to offer some upside.
U.S. Remains a Leader of Global Growth
The first half of 2018 hasn’t quite lived up to the expectations we had at the start of the year, but there are signs that growth is picking back up—and the markets are responding. From a fundamental perspective, at midyear we find ourselves with employment at historic highs, consumer spending growing steadily, and the Fed recognizing that normalization by raising interest rates. A strong U.S. economy will, in turn, reduce the perceived risk level and potentially support global markets.
Interest rate increases likely will be constrained by the continuing policy and monetary stimulus in countries around the world, as well as by ongoing political turmoil in Europe and Asia. Low rates abroad will support U.S. growth, however, and the strengthening dollar will make the U.S. even more attractive as an investment destination. The U.S. continues to remain the primary global growth engine and stable haven, which should add more support to U.S. markets.
Although U.S. financial markets are high by historical standards, improving fundamentals and sentiment support potential appreciation from current levels. As of mid-June, continued improvement remains probable, with earnings growth likely to remain high through year-end and valuations anticipated to increase, in general, with an improving economy.
*****
Brad McMillan, CFA®, CAIA, MAI, is chief investment officer at Commonwealth Financial Network®, the nation’s largest privately held RIA–independent broker/dealer. He is the primary spokesperson for Commonwealth’s investment divisions. He is the primary spokesperson for Commonwealth's investment divisions. This post originally appeared on The Independent Market Observer, a daily blog authored by Brad McMillan.
Forward-looking statements are based on our reasonable expectations and are not guaranteed. Diversification does not assure a profit or protect against loss in declining markets. There is no guarantee that any objective or goal will be achieved. All indices are unmanaged and investors cannot actually invest directly into an index. Unlike investments, indices do not incur management fees, charges, or expenses. Past performance is not indicative of future results.
Commonwealth Financial Network is the nation's largest privately held independent broker/dealer-RIA. This post originally appeared on Commonwealth Independent Advisor, the firm's corporate blog.
This article is intended for informational purposes only and should not be construed as investment advice, a solicitation, or a recommendation to buy or sell any security or investment product. This commentary contains forward-looking statements that are based on reasonable expectations, estimates, projections, and assumptions. They are not guarantees of future performance and involve certain risks and uncertainties, which are difficult to predict. The S&P 500 is based on the average performance of the 500 industrial stocks monitored by Standard & Poor’s.
Copyright © Commonwealth Financial Network®


