


by Jeffrey Saut, Chief Investment Strategist, Raymond James
We have always liked the movie “City Slickers” and particularly one scene. It’s the scene where Curly (Jack Palance) turns to Mitch Robbins (Billy Crystal) and says, “Do you know the secret of life?” The punchline is, “It’s just one thing” (one thing). For investors we agree, all you need to know is just one thing. That thing was pointed out vividly in a book written in the 1920s about a stock operator named Mr. Partridge, often referred to as “Old Turkey” because he was such a shrewd investor. Consequently, many Wall Street wags would ask him, “What do you think I should do in the stock market?” Old Turkey would cock his head to one side, contemplate the question, and with a fatherly smile would say, “You know it's a bull market.” It was as if he were giving you a priceless talisman wrapped up in a million-dollar insurance policy. And currently, the one thing you need to know is that – it is a secular bull market!
Our friends at the invaluable Lowry Research organization recently wrote about this by noting:
From time to time, our commentaries have used a magician as a metaphor for the stock market. That is, one part of the market will serve to distract the audience of investors while the other part does the “magic.” In today’s market, the major price indexes, principally the DJIA and S&P 500, are serving as the distraction while the more significant action is taking place in the broader market.
For example, while most market narratives have been focused on the volatile trading and limited gains in the major price indexes, small cap stocks have been quietly going their own way. In fact, over the past week, both the small cap Russell 2000 Index and S&P 600 Small Cap Index have recorded not only new bull market highs, but also new all-time highs. And, these highs have occurred in broad-based rallies, as both our Operating Companies Only (OCO) and S&P Small Cap Advance-Decline Lines have also reached new bull market and new all-time highs. Since small caps have, historically, been among the first stocks to show developing weakness as a bull market enters its final stages, these new highs in both the small cap price indexes and Advance-Decline Lines suggest an ongoing and healthy primary uptrend showing few signs of age.
While the Russell 2000 (RUT/1626.63) is a good proxy for the overall market (Chart 1), and broke out to the upside in 2013, the Value Line Geometric (VALUG/566.71) is a much broader based index. Studying the attendant chart (Chart 2) one sees that the VALUG just broke-out in September 2017. As our friend Leon Tuey writes:
Many are deeply worried and one of their concerns is the longevity of this bull market. I find the technical structure of the Value Line Geometric Index most intriguing as only in September, 2017, it broke out of a 19-year base. It’s the longest base in the world, except for the NIKKEI (which broke out of a 26-year base). The VALUG is saying that this bull market is still in its infancy.
Plainly, we agree and have said so repeatedly in these reports. As often stated, secular bull markets have three “legs.” We think the first leg began in October 2008 and ended in May 2015. The second leg started in February 2016 when the Royal Bank of Scotland’s strategist said, “Sell everything except high quality bonds.” The second leg is always the longest and strongest. When it ends is unknowable, but if past is prelude the equity markets will go into another upside consolidation, like the one between May 2015 and February 2016, and then breakout to the upside and commence the third leg. To size that, in the 1982 – 2000 secular bull market the third leg began in late 1994 and ended in March of 2000.
As for the here and now, last week was pretty much the end of earnings season. The results show that nearly 68% of reporting companies beat expectation. Meanwhile, roughly 72% bettered revenue estimates (the sector beats can be seen in Chart 3). Despite that, most of the large capitalization indices closed down for the week, while the smaller cap indexes closed up for the week. Impressively, the spread between the percentage of companies raising, versus lowering, forward earnings estimates continues to rise (+4.9%). That’s a level that has only been reached a few times over the past 17 years. As readers of these missives know we stated a few years ago the equity markets have transitioned from an interest rate, to an earnings driven secular bull market.
Speaking of earnings, every earnings season we screen for companies that are favorably rated by our fundamental analysts in the Raymond James research universe, which have beaten both earnings and revenue estimates and raised forward earnings guidance. We also use our proprietary algorithm to see if they are technically favorable. Three such names are: Flir Systems (FLIR/$54.38/Strong Buy), Netflix (NFLX/$324.18/Outperform), and Paylocity Holdings (PCTY/$58.65/Outperform). More recently, over the past six months, we have warmed to the energy sector. That strategy has paid off this earnings season with the energy sector posting a 72.4% leap in earnings for 1Q18 (Chart 4). Moreover, as SentimenTrader’s captain, Jason Goepfert, writes, “Energy stocks enjoying new highs. More than 40% of stocks in the S&P 500 Energy sector have reached a 52-week high.” We continue to like the energy space.
From a trading perspective, we wrote this on Friday, “On a short-term trading basis it looks like a ‘stock market stall’ to us into next week. But, the downside should be limited to the 2670 – 2685 level on the S&P 500 (SPX/2712.97) because the intermediate ‘energy mix’ is still near a full charge.” One of the recent headwinds has been the backup in the 10-year T-note yields, which have risen from their yield-yelp lows of 1.34% in July 2016 to last week’s intraday day high of 3.115% (we have been bearish on fixed income). The other headwind is that the inflation genie may be out of the box (we have been bullish on inflation). As written, the “inflation genie” is being reflected in trucking rates that have risen some 27% year-to-date. We believe inflation is coming and have written about that many times. We do not, however, think it will be anywhere near the 1970/1980s ramp rate. Accordingly, we have tilted toward “stuff stocks” (midstream MLPs, metals, agriculture, etc.). We have also recommended avoiding the defensive sectors (consumer staples, utilities, etc.), for the past 18 months, because they were as expensively valued as they have been in decades, and they are casualties of higher interest rates and inflationary pressures.
BINGO, the defensive sectors have lost ground over that timeframe. We continue to think the economy, despite the mixed signals in the near term, is going to strengthen in the back-half of this year. That seems to be the message of the stock market and we agree. While NOBODY can consistently “time” the stock market, if one listens to the message of the market, one can decide if they should be playing “hard,” or “not so hard.” Since January 2018 I have not been playing very “hard,” but did re-commit some of the cash, raised in January, near the early February lows. I continue to invest, and trade, accordingly.
The call for this week: We think downside attempts for the equity markets will be contained given the economic, and earnings, backdrop. The downside should be well supported for the SPX in the 2670 – 2685 level. As Lowry Research writes:
In summary, investors should avoid being distracted by the sluggish performances in the DJIA and S&P 500, but instead should focus on the abundant signs of a healthy bull market and the opportunities for new buying being afforded by this underlying strength.
This morning the preopening S&P 500 futures are up by some 15 points as China says the trade war is on “hold.” As we have said since the “under cut” low of February 9, “the lows are in!”
Chart 1
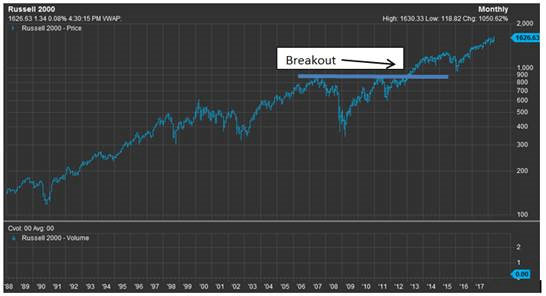
Source: FactSet
Chart 2
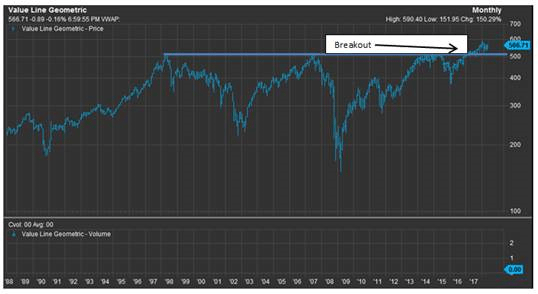
Source: FactSet
Chart 3
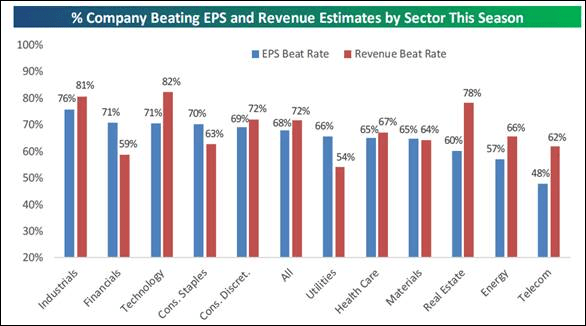
Source: Bespoke Investment Group
Chart 4
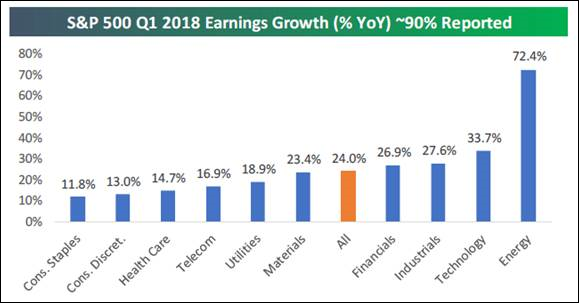
Source: Bespoke Investment Group
Additional information is available on request. This document may not be reprinted without permission.
Raymond James & Associates may make a market in stocks mentioned in this report and may have managed/co-managed a public/follow-on offering of these shares or otherwise provided investment banking services to companies mentioned in this report in the past three years.
RJ&A or its officers, employees, or affiliates may 1) currently own shares, options, rights or warrants and/or 2) execute transactions in the securities mentioned in this report that may or may not be consistent with this report’s conclusions.
The opinions offered by Mr. Saut should be considered a part of your overall decision-making process. For more information about this report – to discuss how this outlook may affect your personal situation and/or to learn how this insight may be incorporated into your investment strategy – please contact your Raymond James Financial Advisor.
All expressions of opinion reflect the judgment of the Equity Research Department of Raymond James & Associates at this time and are subject to change. Information has been obtained from sources considered reliable, but we do not guarantee that the material presented is accurate or that it provides a complete description of the securities, markets or developments mentioned. Other Raymond James departments may have information that is not available to the Equity Research Department about companies mentioned. We may, from time to time, have a position in the securities mentioned and may execute transactions that may not be consistent with this presentation’s conclusions. We may perform investment banking or other services for, or solicit investment banking business from, any company mentioned. Investments mentioned are subject to availability and market conditions. All yields represent past performance and may not be indicative of future results. Raymond James & Associates, Raymond James Financial Services and Raymond James Ltd. are wholly-owned subsidiaries of Raymond James Financial.
International securities involve additional risks such as currency fluctuations, differing financial accounting standards, and possible political and economic instability. These risks are greater in emerging markets.
Investors should consider the investment objectives, risks, and charges and expenses of mutual funds carefully before investing. The prospectus contains this and other information about mutual funds. The prospectus is available from your financial advisor and should be read carefully before investing.
Copyright © Raymond James