by Carl R. Tannenbaum, Ryan James Boyle, Vaibhav Tandon, Northern Trust
SUMMARY
- Oil’s Rise
- The E.U. Has Its Own Concerns About China
- More Hours In The Week
The end of the academic year is approaching. For parents of college students, this means folding down the seats in your vehicle and driving to campus for departure day. All too often on these occasions, the “movers” arrive to find their student unprepared (and even, on occasion, fast asleep). What ensues is a frenzied few hours that involve stuffing a broad range of belongings into garbage bags for the trip back home.
These voyages use a lot of gasoline, which means trips to the filling station. On those occasions, motorists often feel as though they are pulling the arm of a slot machine. The dial spins for a while and finishes on a random outcome. Sometimes you’re happy; sometimes, you’re not.
This year’s campus-homestead transitions are going to be expensive propositions. After hovering around $50 per barrel for a long while, oil prices have been rising steadily for the past six months. If the trend is sustained, it could have an important influence on global economic performance.
We last discussed oil this past October. At that time, prices were tightly range-bound. The Organization of Petroleum Exporting Countries (OPEC) was on the back foot, struggling to control its members and facing increased competition from non-OPEC providers. Global inventories were high and alternative fuels were advancing, leading key oil producers to contemplate life after petroleum.
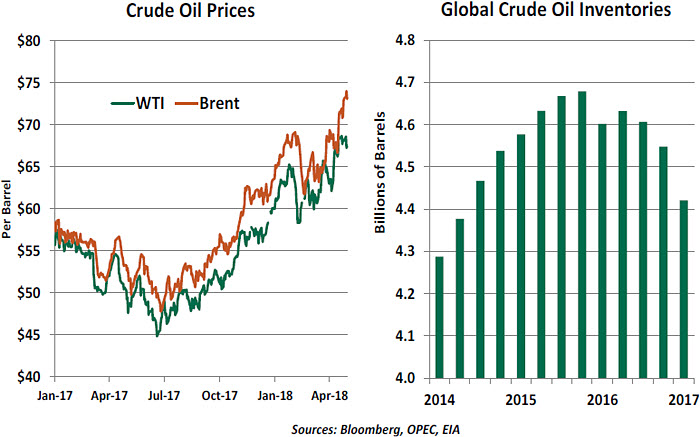
Since then, a series of factors have conspired to push crude prices upward.
-
- Global demand has improved, thanks to accelerating growth in the United States and Europe. Vehicle ownership and usage continue to expand in developing markets (China, in particular) and shipping volumes have been rising world-wide. Global air travel continues on a sharp upward trajectory. With economic performance expected to continue growing, energy demand is unlikely to diminish.
-
- OPEC members have generally adhered to the supply reductions agreed in 2016. Production from OPEC countries and Russia has declined by about 6% since last fall; with prices rising, the cost of these restrictions has been falling. OPEC members will meet later this month to discuss renewing production ceilings, and they are widely
expected to keep the limits in place.
- OPEC members have generally adhered to the supply reductions agreed in 2016. Production from OPEC countries and Russia has declined by about 6% since last fall; with prices rising, the cost of these restrictions has been falling. OPEC members will meet later this month to discuss renewing production ceilings, and they are widely
-
- The stability of global oil supplies is a subject of concern. Venezuela’s economic collapse has hindered its production; oil workers have been leaving the country in droves, and the additives required to make its oil marketable are in short supply.
-
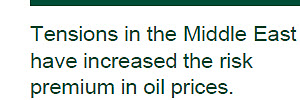
- Rising tensions in the Middle East, including attempted missile strikes from Yemen on Saudi oil infrastructure, could curtail production in the region. Overall, the risk premium within the price of crude has been increasing.
- Iran, whose production has been rising steadily, could be squeezed if talks over its nuclear program devolve. The White House faces a decision next week on whether to re-apply sanctions against Tehran; analysts suggest new limitations could reduce Iran’s production by 1 million barrels per day.
On another front, tensions between Russia and the West have engendered new restrictions on commerce between the two. This has hindered the flow of equipment and the development of pipelines that would facilitate more widespread distribution of oil from that country.
U.S. producers have responded to higher prices by opening their spigots. American output has risen by almost
1 million barrels per day so far in 2018; there are 13% more wells actively producing oil than there were last November. Analysts expected this rapid reaction, but it has not been enough to place a cap on prices.
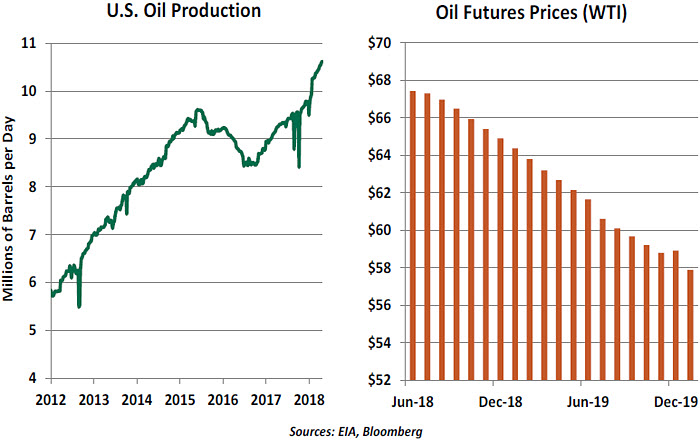
Partly as a result of this, futures markets are anticipating that oil prices will ease in the months ahead. Contracts one year forward are priced at more than $5 per barrel less than current spot prices. This condition (called “backwardation”) may serve OPEC’s purposes very well. An outlook for lower prices may limit the expansion of U.S. production, as fields requiring higher prices to cover extraction costs may remain idle.
 If oil remains expensive, it could have important effects on the global economy. Oxford Economics estimates that a rise to $85 per barrel would reduce global growth by more than 0.5% over the next two years, a substantial amount. Inflation would rise by 1% over that same interval: good for central banks trying to get inflation up to targeted levels, but bad for purchasing power in energy-consuming nations.
Any pass-through to core inflation in the U.S. could prompt the Federal Reserve to raise rates more rapidly than currently anticipated. And as we highlighted last week, oil has a powerful influence on inflation expectations. Sustained prices in excess of $65 could produce additional upward pressure on long-term interest rates.
Energy markets are notoriously difficult to forecast. So many variables can affect equilibrium, and they can shift suddenly and substantially. Experts in the field are anticipating that current prices will be sustained, but potential error around this projection is wide in both directions.
I can, however, anticipate at least one element of the energy price equation with some certainty. My collegian will undoubtedly demand automobile privileges when she returns home, which will increase our gasoline consumption considerably. To add insult to injury, she will probably be using my car. Fortunately, the walk home from the train station only takes forty minutes, and at least the price of a stroll won’t change.
Europe, Looking East
Recently, we examined the current US-China trade frictions and compared them with those witnessed during the rise of Japan from the 1950s to 1990s. In our most recent publication, we looked at China as a consideration in discussions surrounding the North American Free Trade Agreement (NAFTA).
But the United States isn’t the only one anxious to re-set trade terms with China. The European Union (EU) is facing similar challenges on that front, as evidenced by increased EU resistance to Chinese trade practices. If the U.S. gets a better deal, the EU will be hoping for the same arrangement.
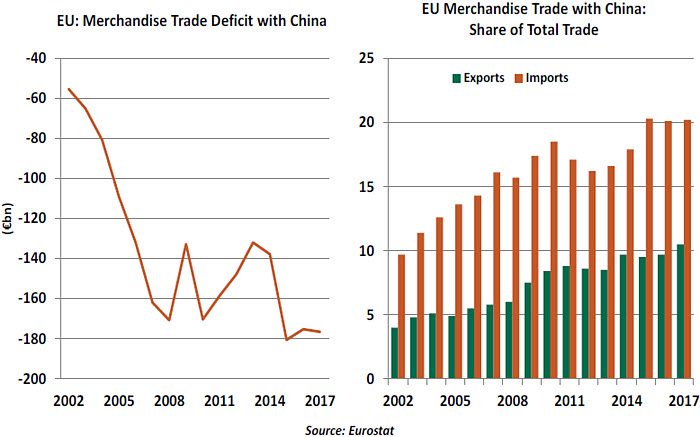
Trade between the EU and China has expanded at a rapid pace since China joined the World Trade Organization (WTO) in 2002. Since then, the EU’s total trade with China has more than quadrupled, to €573 billion in 2017. The growth is bilateral: exports from the EU to China have jumped from €35 billion to €198 billion, and imports have risen from €90 billion to €375 billion over the past 15 years.
The net result of these trends has left the EU with a persistent merchandise trade deficit with China. The imbalance has grown to €177 billion, three times higher than its 2002 level.
Though the U.S. is the largest trading partner of the EU, accounting for 16.9% of total EU merchandise trade, China isn’t far behind with a 15.3% share. The key differentiating factor in the EU-China and EU-U.S. trade linkages is that China is the biggest source of the EU’s imports. China accounts for 20.2% of total EU imports. By contrast, the U.S. is the EU’s biggest export market: 20% of EU exports go to the U.S., compared to just 10.5% to China.
 The rising trade deficit with China has caught the attention of European commissioners. As per the strategy on China adopted in 2016, the EU wants to ensure a relationship that “promotes reciprocity, a level playing field and fair competition across all areas of co-operation” with China.
The document also presciently stated that “The EU is seriously concerned about industrial over-capacity in a number of industrial sectors in China, notably steel production. If the problem is not properly remedied, trade defence measures may proliferate, spreading beyond steel to other sectors such as aluminum, ceramics and wood-based products.” Beyond the industrial over-capacity, the EU’s other concerns include discrimination against foreign companies, excessive government intervention by the Chinese and safeguarding of intellectual property.
The EU has taken actions to raise its concerns. In November 2017, the European Parliament passed new anti-dumping rules that require non-EU trading partners to comply with international social and environmental standards, a move aimed at curbing cheap imports. These new rules were opposed by handful of nations, including China. The EU is also closely examining the option of filing complaints against China with the World Trade Organization (WTO).
Though the EU shares many of the United States’ complaints with China’s trade practices, its approach toward resolution stands in contrast with the sharp one adopted by the U.S. administration. European Commission spokesman Daniel Rosario recently stated that “the EU believes that measures should always be taken within the WTO framework, which provides numerous tools to effectively deal with trade differences.” Though the EU’s tactics may be slower and quieter than those of the U.S., its posture toward trade with China is similar.
Feeling Full?
The low unemployment rate in the U.S., currently standing at 3.9%, leads to speculation as to whether we are at full employment. The concept of a natural rate of unemployment is hard to pin down. If we were indeed in a labor market with no slack, we would expect to see job creation fall as employers struggle to fill vacancies, or employees’ hours to rise as employers push for greater output. Neither trend has emerged yet in this cycle. Indeed, U.S. workers are putting in a surprisingly steady number of hours each week.
 One explanation for this trend can be found in the part-time workforce. Some members of this group identify as part-time for economic reasons: they would prefer to work full-time but cannot find a role with sufficient hours. But not all part-time workers are necessarily seeking more hours. Some indicate they are working part-time for non-economic reasons,
in which the worker chooses to not work a full week. They may be raising children, taking classes or partially retired. This is one driver of the flat trend of hours worked.
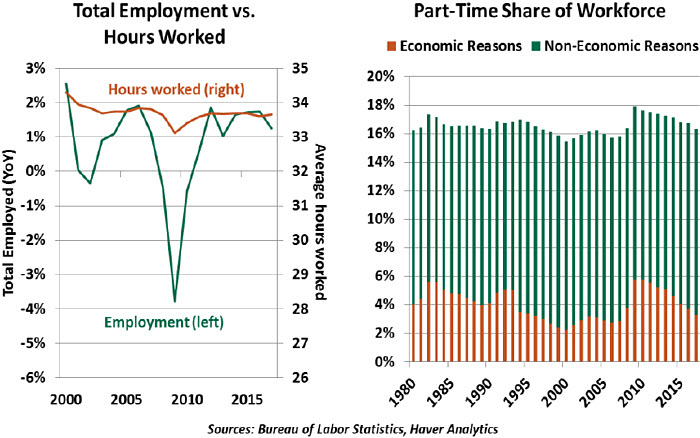
As the number of people working in the U.S. continues to grow, the share of workers employed part-time has been consistent, hovering in the range of 15-18% every year since 1970. A larger share of workers part-time for economic reasons is generally a bad sign for workers, because it signifies their disconnection from the opportunities that would suit them best. The share of workers identifying in this manner peaked at a third of the part-time workforce in 2010. In a positive sign for the economy, the share is now below its long-run average.
The total share of part-time workers is approaching the low levels observed during other strong economic intervals. As more jobs have been created and more workers have moved from part-time to full-time, the trend of flat hours may come as a surprise. Full-time employment, by definition, entails more hours, and we would expect the average to move higher. The steady trend suggests that full-time workers are not yet putting in overtime, and some slack may remain in the work day for employers willing to pay overtime incentives. As we look for reservoirs of labor supply, this may be one source.
northerntrust.com
Information is not intended to be and should not be construed as an offer, solicitation or recommendation with respect to any transaction and should not be treated as legal advice, investment advice or tax advice. Under no circumstances should you rely upon this information as a substitute for obtaining specific legal or tax advice from your own professional legal or tax advisors. Information is subject to change based on market or other conditions and is not intended to influence your investment decisions.
© 2018 Northern Trust Corporation. Head Office: 50 South La Salle Street, Chicago, Illinois 60603 U.S.A. Incorporated with limited liability in the U.S. Products and services provided by subsidiaries of Northern Trust Corporation may vary in different markets and are offered in accordance with local regulation. For legal and regulatory information about individual market offices, visit northerntrust.com/disclosures.
Copyright © Northern Trust


