Earnings season has arrived at last with mixed results from Corporate America. Although broad indices have been trying to bounce off the good results, there have been pockets of significant weakness. Technology remains very mixed with Netflix climbing on good results, while IBM and Lam Research have been slammed on disappointments. US banks, particularly regionals, have also been sliding down the relative strength rankings as investors weigh the potential drag of rising interest rates on future earnings.
Meanwhile, commodities continue to climb, particularly crude oil and copper. Falling US energy inventories have kept a tailwind behind WTI. Copper, meanwhile, has benefitted from a stronger than expected 6.8% growth in Chinese GDP and the risk of a trade war fading for now. Energy stocks have been responding selectively to higher oil prices but this hasn’t translated into a broader pickup in relative strength for the sector as of yet. So far big caps have been leading the charge, but we would need to see breadth increasing by more energy stocks taking part to confirm a turnaround for the beleaguered sector.
In this issue of week’s SIA Equity Leaders Weekly, we change focus from our usual coverage of stocks and commodities to highlight action in currencies, the world’s largest and most liquid asset class. Currencies have been climbing up the SIA Charts Asset Class Rankings this year and currently sit in third place. Remember when looking at forex charts, the chart is tracking the first currency in the pair up and down.
United States Dollar / Canadian Dollar (USDCAD) "Loonie"
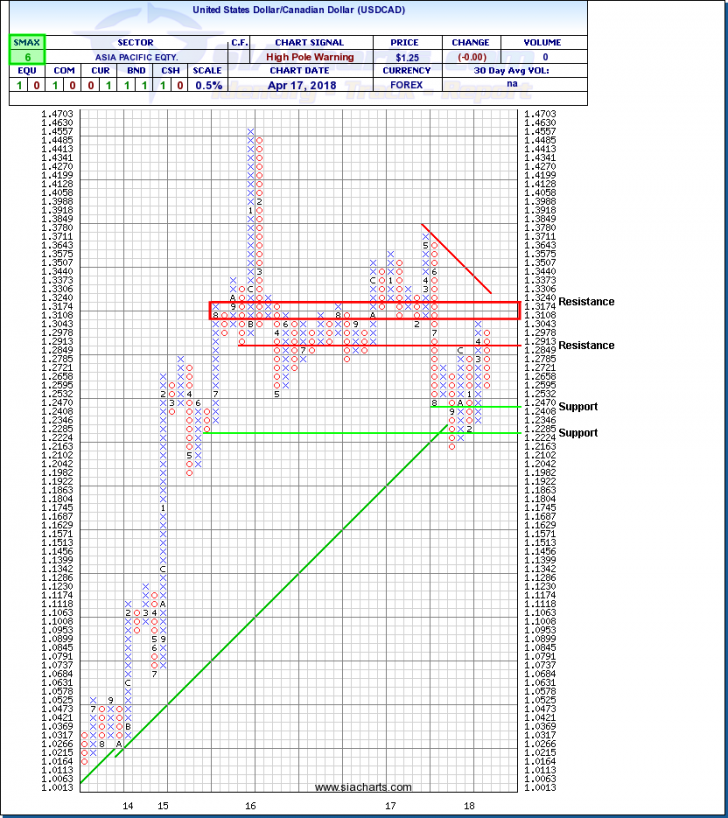
USDCAD has staged a number of significant swings over the last year. The pair declined through the second half of 2017 as CAD gained relative strength from the Bank of Canada taking a hawkish turn and raising interest rates three times. Following the last rate hike in January, however, concerns that U.S. policy decisions could spark a trade war sent USDCAD upward in favour of the U.S. Dollar. The pair reached $1.3000 briefly but failed to break through a resistance zone between $1.3108 and $1.3240.
In recent weeks, the tide of relative strength appears to have turned back into CAD’s favour in the near-term and USDCAD has started to decline once again, sliding back toward $1.2550, but technical signals are mixed. A High Pole Warning suggests that a downturn may be coming but a positive 6 SMAX score and the lack of a proper bearish signal suggest the bullish trend has not broken yet and this could be a normal pullback as history has shown with this currency pair.
A break under the $1.2470 support could start of a new downtrend for USDCAD with next potential support near $1.2224. If that support zone holds, however, the pair could bounce back toward $1.2913 initial resistance.
On the fundamental side, the price of oil continues to rise. WTI broke out again Wednesday and continued gains for oil could push USDCAD lower. Earlier this year, worries over tariffs and the risk of a trade war potentially impacting Canada pushed USDCAD upward, but the pair has fallen back as Canada was excluded from US steel tariffs and NAFTA talks have continued to inch toward an agreement with the pressure on to get a deal done before this year’s elections in the US and Mexico.
USDCAD had been rallying earlier in the year after the Bank of Canada paused its rate hike program to wait and see the lay of the land on trade and the impact of minimum wage increases plus new real estate rules that kicked in at the start of the year. Wednesday’s Bank of Canada statement indicating higher inflation, combined with trade uncertainty easing suggest that the Bank could resume raising rates. This week’s Canadian ADP employment (Thursday) and retail sales plus inflation (Friday) numbers could influence speculation of whether the next rate hike could come in May or July.
Click on Image to Enlarge
British Pound / United States Dollar (GBPUSD) “Cable”
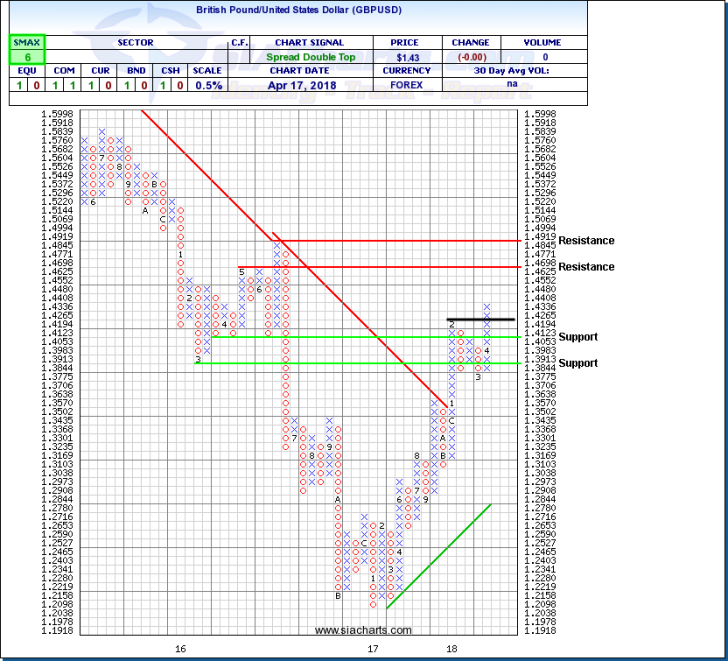
Cable had been completely crushed following the UK’s decision to leave the European Union, but as the negotiations have progressed and the future of the cross-channel relationship slowly takes shape, the Pound has been steadily recovering against the US Dollar and the Euro.
GBPUSD staged a big rally to start the year then levelled off in the $1.3750 to $1.4250 area in what looks like a normal, healthy consolidation. Cable recently blasted through a former resistance level at $1.4265 to complete a bullish Spread Double Top point and figure chart signal and signalling that the primary uptrend may have resumed. Next potential resistance appears near $1.4698 then at $1.4919. Minor support could emerge near the breakout point followed by $1.4053.
SIACharts.com specifically represents that it does not give investment advice or advocate the purchase or sale of any security or investment. None of the information contained in this website or document constitutes an offer to sell or the solicitation of an offer to buy any security or other investment or an offer to provide investment services of any kind. Neither SIACharts.com (FundCharts Inc.) nor its third party content providers shall be liable for any errors, inaccuracies or delays in content, or for any actions taken in reliance thereon.
For a more in-depth analysis on the relative strength of the equity markets, bonds, commodities, currencies, etc. or for more information on SIACharts.com, you can contact our sales and customer support at 1-877-668-1332 or at siateam@siacharts.com.


