by Paul Kasriel, The Econtrarian
Thin-Air Credit Growth Slowdown Augurs Poorly for 2018 Domestic Demand Growth
A majority of my readers (two) have asked me to update the discussion about the behavior of thin-air credit or a variant thereof, namely the sum of commercial bank credit (loans and securities) and the monetary base (bank reserves at the Fed and currency). To paraphrase the motto of the former iconic Chicago department store, Marshall Field’s, give the customers what they want. To give the “customers” a preview of what they are going to get, let me state that thin-air credit growth has slowed to a rate that is low both from a long-run and short-run perspective. The slowing growth in nominal thin-air credit in conjunction with the acceleration in consumer price inflation has negative implications for growth in real U.S. aggregate domestic demand in 2018. In turn, if growth in real aggregate domestic demand “surprises” on the downside in 2018, then the Fed is unlikely to hike the federal funds rate the full 50 basis points this year that the market currently expects. Alternatively, if the Fed is hell-bent on raising the federal funds rate 50 basis points or more over the remainder of 2018, it would be sowing the seeds of a 2019 recession unless there is an acceleration in the growth of nominal and real thin-air credit. An acceleration in the growth of thin-air credit would be unlikely in the face of a rising federal funds rate.
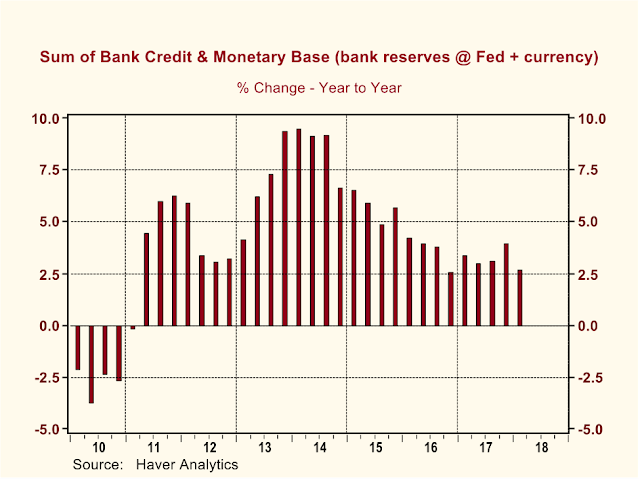
As shown in Chart 1, year-over-year growth in thin-air credit has trended lower from its 9+ percent observations from Q4:2013 through Q3:2014. As of Q1:2018, year-over-year growth in thin-air credit was 2.7% -- low growth in terms both of a long-run and short-run historical perspectives.
Chart 1
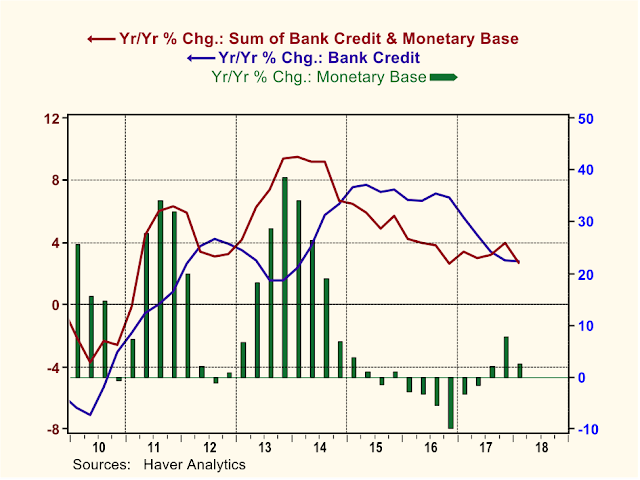
Plotted in Chart 2 are the year-over-year percent changes in the quarterly observations of, again, thin-air credit (the sum of commercial bank credit and the monetary base) along with the percent changes in each of its major components – commercial bank credit and the monetary base – by themselves. The slowing growth in thin-air credit (the red line) in 2015 and 2016 was primarily due to the Fed’s cessation of quantitative easing (QE), i.e., large outright purchases of government securities and quasi-government mortgage-backed securities, which resulted in the year-over-year contractions in the monetary base (the green bars). Surprisingly, at least so to me, was the rebound in year-over-year growth in the monetary base in the past three quarters inasmuch as the Fed had started to reduce, albeit marginally, its outright holdings of securities and the Fed had been hiking the federal funds rate. Starting in 2017 and continuing through the first quarter of 2018, growth in commercial bank credit the blue line) has been trending lower, which has restrained the growth in thin-air credit.
Chart 2
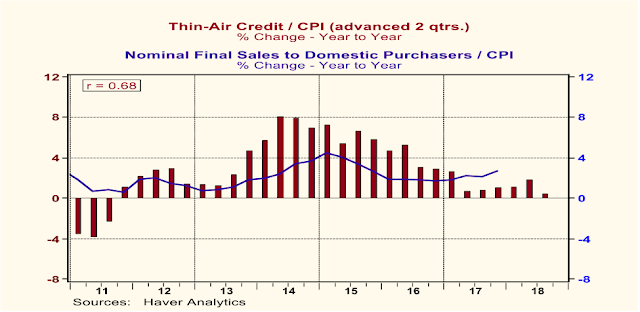
Not only has growth in nominal thin-air credit slowed, but so, too, has growth in real thin-air credit, i.e., nominal thin-air credit deflated by the Consumer Price Index (CPI). In Q1:2018, the year-over-year percent change in real thin-air credit was just 0.5%. The importance of this is that there is a relatively high correlation between the year-over-year growth in real thin-air credit and real final sales to domestic purchasers. Starting in Q1:2011, the correlation coefficient between the year-over-year percent changes in real final sales to domestic purchasers and the year-over-year percent changes in real thin-air credit, advanced two quarters, is 0.68 out of maximum possible 1.00. This is shown in Chart 3.
Chart 3
As one of my readers (the other one?) has correctly pointed out, correlation does not necessarily imply causation. However, when I tested the lead-lag relationships between these two series, I found that the correlation coefficient was highest when thin-air credit growth leads growth in real final sales to domestic purchasers by two quarters. When growth in real final sales to domestic purchasers leads growth in real thin-air credit, the correlation coefficient declines. This does not prove that growth in thin-air credit causes growth in real final sales to domestic purchasers, but it sure does support the hypothesis.
In sum, the slowing in the growth of both nominal and real thin-air credit augurs poorly for the growth in aggregate domestic demand in 2018. But wait, won’t this year’s federal tax cuts stimulate demand? Not unless the resulting increased deficits are financed with the creation of thin-air credit. (See my January 22, 2018 blog post “No Sugar High from Tax Cut Unless the Fed and the Banking System Provide the Sugar” for an explanation of this). And, so far, at least, growth in thin-air credit has slowed, not accelerated. The market currently expects the Fed to hike the federal funds rate at least another 50 basis points this year. If I am right that growth in domestic demand slows this year, a further 50 basis point increase in federal funds rate might be sowing the seeds of 2019 recession. Available data, such as annualized growth in Q1:2018 nominal retail sales of 0.8% vs. 10.4% in Q4:2017, suggest a slowing in the growth of Q1:2018 final sales. Rumor has it that the Fed believes this slowing in aggregate demand growth is mainly due to “faulty” seasonal adjustment factors. The Fed ought to take a look at the behavior of thin-air credit growth before dismissing the weakness in first quarter final sales growth.
Paul L. Kasriel, Founder, Econtrarian, LLC
Senior Economic and Investment Advisor
Legacy Private Trust Co., Neenah, WI
1-920-818-0236
“For most of human history, it made good adaptive sense to be fearful and emphasize the negative; any mistake could be fatal”, Joost Swart ∆ + 6 = A Good Life


