by Jeffrey Saut, Chief Investment Strategist, Raymond James
The China Syndrome is a 1979 disaster thriller movie about a television reporter and her cameraman who discover safety cover-ups at a nuclear power plant and stars Jane Fonda, Jack Lemmon, and Michael Douglas. According to Wikipedia:
While visiting the (fictional) Ventana nuclear power plant outside Los Angeles television news reporter Kimberly Wells (Jane Fonda), her cameraman Richard Adams (Michael Douglas) and their soundman Hector Salas witness the plant going through an emergency shutdown. Shift Supervisor Jack Godell (Jack Lemmon) notices an unusual vibration while grabbing his cup of coffee, which he had set down. He then finds that a gauge is misreading and that the coolant is dangerously low (he thought it was overflowing). The crew manages to bring the reactor under control and can be seen celebrating and expressing relief.
The definition of a China syndrome is, “A hypothetical sequence of events following the meltdown of a nuclear reactor in which the core melts through its containment structure and deep into the earth; hypothetically to China.”
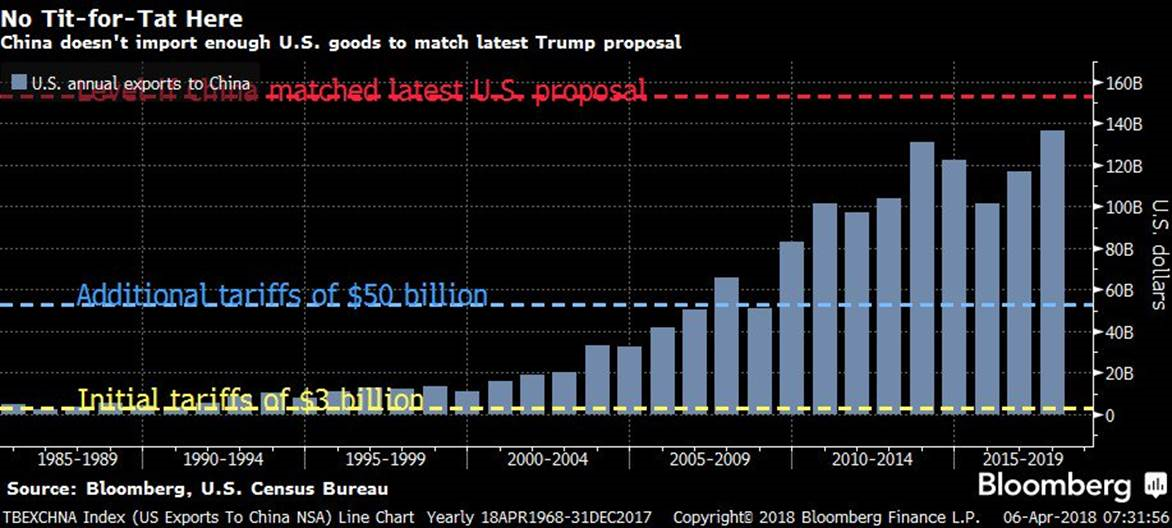
We think the movie is an appropriate analogy given last Friday’s Chinese induced “meltdown.” By now everybody knows Friday’s Flop” (-572 Dow points) was attributed to the president’s tweets about the potential for an additional $100 billion in tariffs to the already proposed $50 billion. That would bring the total amount up to $150 billion, to which China said, “We will fight back at any cost against U.S. trade tariffs.” In response to the first $50 billion in tariffs the Chinese made a proportional $50 billion in tariffs on U.S. “goods.” The fear on Friday was that China would make an equal proportional response to the $100 billion of potentially additional tariffs on U.S. goods, but here’s the problem. Last year we exported only ~$130 billion worth of goods to China, so their response cannot be proportional (Chart 1)! Granted, China could do other things.
As we stated weeks ago, they could cancel their orders for Boeing aircraft and switch to Airbus and still be in compliance with the World Trade Organization’s (WTO) rules. Or, they could begin to liquidate their $1+ trillion worth of U.S. fixed income, which they think would crater our bond market. However, the Federal Reserve could counter that move with emergency “open market” operations and soak up the selling. Indeed, if the Fed can buy $3+ trillion worth of Treasuries and mortgage bonds with QEs, it can certainly absorb any Chinese selling. Moreover, if China did manage to trigger a financial crisis, the blowback across the globe would be significant and deeply affect China itself. It would also violate China’s promise to “Protect the multilateral framework.” So, we think the markets overreacted on Friday, a view that will either be proven correct this week, or disproved.
Some other reasons were offered over the weekend for the stock slide. The sanctions on the Russian oligarchs was one reason, yet rich Russians no longer are as Kremlin impactful as they were years ago. Conflicting comments from NEC Director Larry Kudlow and Treasury Secretary Mnuchin on CNBC was another reason. Comments by Fed head Powell regarding his intention to keep raising interest rates were somewhat disquieting. The Facebook and Amazon consternations were yet another. Last week’s soft economic reports may be somewhat responsible. Or how about this from our friends at Bespoke Investment Group:
As long as the market believes there is a possibility the Trump administration will follow through, equities face headwinds, and rightfully so; a trade war would be disastrous for risk sentiment, corporate profits, and global activity. In that sense, if the Trump Administration is trying to bluff China, it faces trouble, because it has political constraints [that] China doesn’t. Midterm elections are now exactly 7 months away.
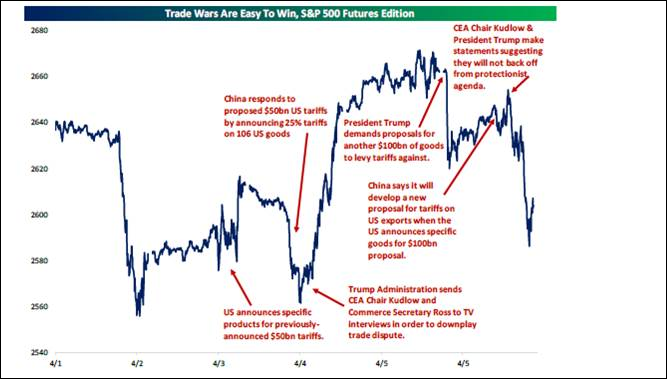
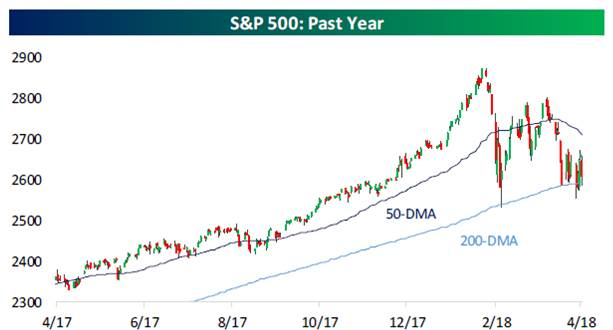
Our sense remains the stock market’s recent rallies, and declines, have been induced by the tariff talks, as can be seen in Chart 2. Speaking to those recent gyrations, we stated in Friday’s Morning Tack, “The fact the S&P 500 [SPX/2604.47] stalled yesterday at the 2660 – 2670 level should come as no surprise to readers of these missives because we have often mentioned that level is a resistance zone.” What was surprising was the extent of Friday’s swan dive. The result saw the SPX once again test its 200-day moving average (DMA) at 2593.70 leaving that index trapped between its 50-DMA and its 200-DMA (Chart 3). As our pal Leon Tuey writes:
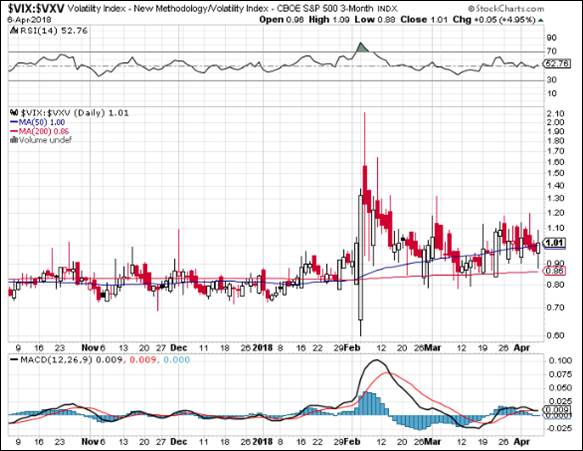
The VIX vs. the TNX and the VIX vs. the VXV are two of the many sentiment indicators that I track and both have an excellent record of identifying intermediate market bottoms. When they move above 1.00, the market stands at a low-risk, high-reward juncture point. In the week of February 5, both indicators exceeded 1.00 by a wide margin. In the week of March 19, the $VIX:$VXV exceeded 1.00 again. In early February, extreme fear was witnessed. Hence, peak selling intensity has been witnessed and I doubt that those highs will be exceeded any time soon [Chart 4]. Note that although the Dow Jones Industrial Average stands at a new reaction low and the S&P is within a cat’s whisker of new low, these indicators are nowhere near their respective February highs. Hence, the sentiment backdrop is ideal.
As mentioned, the market’s short-term direction is driven by two factors – technical and sentiment. All other reasons given, there is no way of proving whether they are true or not, even after the fact. Currently, the market is oversold and as mentioned, sentiment backdrop is ideal. Conclusion is clear – the market stands at a low-risk, high-reward juncture point. How about the “Trade War”? Who knows the outcome? I am willing to bet that cooler heads prevail. Because of the black headlines and the deafening “noise,” investors don’t believe this. Refrain from joining the crowd. As Warren Buffett advised, “be fearful when others are greedy and be greedy when others are fearful.” Those who are waiting for “clarity” will miss the boat.
The call for this week: Last Monday was a 90% Downside Day, meaning 90% of the upside to downside volume came in on the downside, combined with 90% of the total points traded also coming in on the downside. The next morning the D-J Industrials (INDU/23,932.76) were off over 500 points, right after the opening bell, and we were buyers and said so on Fox Business News. Subsequently, the Industrials reversed and ended up some 389 points. Wednesday was an upside follow-through session with the Dow better by ~231 points. Unfortunately, neither of those positive sessions were 90% Upside Days, nor even 80% Upside Days. Thursday was a “pause” at up ~65 points, and then came the overnight tariff news that unsettled the equity markets on Friday (-572 points). We must admit it is troubling that volume has been much higher on the down days, but that is how bottoms are made. Worth mentioning is the 14-day Relative Strength Index (RSI) has been below 50 for 13 sessions, and counting, a sign the equity markets are oversold. For the week the INDU lost 0.71% and the SPX declined by 1.38%. However, the real losers on the week were the NASDAQ 100 (-2.25%), the D-J Transports (-2.41%), Crude Oil (-4.39%), and Palladium (-6.26%). Despite the Transports’ Tumble there still was no Dow Theory “sell signal,” although the Transports reside a mere 10-points above their February closing low of 10,136.61. Even if we finally get a DT “sell signal,” we doubt we would honor it because we think it would be created by an aberration, a similar stance we took on the false DT “sell signals” of May 2010 and August 2015. However, the recent relapse did cause a breakdown in the trendline chart formations of the following sectors: consumer staples, healthcare, industrials, materials, and the utility sector. In conclusion, our measurement of the stock market’s “internal energy” shows there should be a burst of upside energy arriving sometime this week. This morning the preopening S&P 500 futures are sharply higher (+21 points) as we write at 5:31 a.m. because of this tweet by DJT, “President Xi and I will always be friends, no matter what happens with our dispute on trade. China will take down its Trade Barriers because it is the right thing to do. Taxes will become reciprocal and a deal will be made on intellectual property. Great future for both countries.” We continue to think the undercut low of February 9 was THE low . . .
Chart 1
Source: Bloomberg
Chart 2
Source: Bespoke Investment Group
Chart 3
Source: Bespoke Investment Group
Chart 4
Source: Stockcharts.com
Additional information is available on request. This document may not be reprinted without permission.
Raymond James & Associates may make a market in stocks mentioned in this report and may have managed/co-managed a public/follow-on offering of these shares or otherwise provided investment banking services to companies mentioned in this report in the past three years.
RJ&A or its officers, employees, or affiliates may 1) currently own shares, options, rights or warrants and/or 2) execute transactions in the securities mentioned in this report that may or may not be consistent with this report’s conclusions.
The opinions offered by Mr. Saut should be considered a part of your overall decision-making process. For more information about this report – to discuss how this outlook may affect your personal situation and/or to learn how this insight may be incorporated into your investment strategy – please contact your Raymond James Financial Advisor.
All expressions of opinion reflect the judgment of the Equity Research Department of Raymond James & Associates at this time and are subject to change. Information has been obtained from sources considered reliable, but we do not guarantee that the material presented is accurate or that it provides a complete description of the securities, markets or developments mentioned. Other Raymond James departments may have information that is not available to the Equity Research Department about companies mentioned. We may, from time to time, have a position in the securities mentioned and may execute transactions that may not be consistent with this presentation’s conclusions. We may perform investment banking or other services for, or solicit investment banking business from, any company mentioned. Investments mentioned are subject to availability and market conditions. All yields represent past performance and may not be indicative of future results. Raymond James & Associates, Raymond James Financial Services and Raymond James Ltd. are wholly-owned subsidiaries of Raymond James Financial.
International securities involve additional risks such as currency fluctuations, differing financial accounting standards, and possible political and economic instability. These risks are greater in emerging markets.
Investors should consider the investment objectives, risks, and charges and expenses of mutual funds carefully before investing. The prospectus contains this and other information about mutual funds. The prospectus is available from your financial advisor and should be read carefully before investing.
Copyright © Raymond James


