
by Jodie Gunzberg, Managing Director, Head of U.S. Equities, S&P Dow Jones Indices
Let’s use the S&P 500 as a starting point since it is the most basic beta, or representation of the U.S. stock market. Since its launch in 1957, it has grown with the stock market and has become the most widely used benchmark of the U.S. stock market with numerous products tracking it. Although in the beginning of its history, it tracked basically the entire stock market, it still captures about 80-85% of the total market today.
In order to be included in the S&P 500, a stock must be a common stock of a U.S. company, there should be a minimum market cap of $6.1 billion with at least half of outstanding shares available for trading, and there should be a positive sum of the most recent 4 quarters of earnings with the last quarter positive. However, once the stocks are in the index, they don’t necessarily need to meet these criteria to remain in the index. The index is reviewed at least monthly to determine any changes, and there have been about 20-25 changes per year based on events that happen to the companies such as mergers and acquisitions.
There are currently 505 constituents with a median market cap of $21.6 billion and average market cap of $48.4 billion. In the index, the stocks are weighted by float adjusted market capitalization. The results is the top ten constituents make up just over 20% of the S&P 500, and information technology is the biggest sector, making up over 25% of the index. Together with the financial sector, they comprise about 40% of the index.
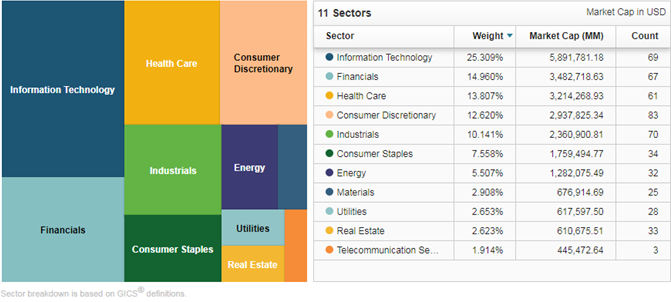
Source: S&P Dow Jones Indices, LLC. As of close of business March 7, 2018.
While the S&P 500 represents the U.S. stock market and can be considered the purest beta, the return profile may not be for everyone. So, many managers have entered the industry through the past several decades trying to beat the index. With that has come much great research, in particular, showing a small cap premium. In 1984, on the back of research by Rolf Banz, Russell launched the Russell 2000 to measure their small cap managers in their consulting business, and most of the time, the managers were able to beat the benchmark.
However, a decade later, the better known Nobel prize winner Eugene Fama and his co-author Kenneth French introduced the 3-factor model using market risk and value in addition to small cap, and it has since been shown by many, including Assness, the small cap premium is stable and significant when quality is a factor. This research led to the development of the S&P MidCap 400 and S&P SmallCap 600 by 1994, which are much harder for managers to beat, and it is important for the exposure and performance in equally weighted and pure style indices.
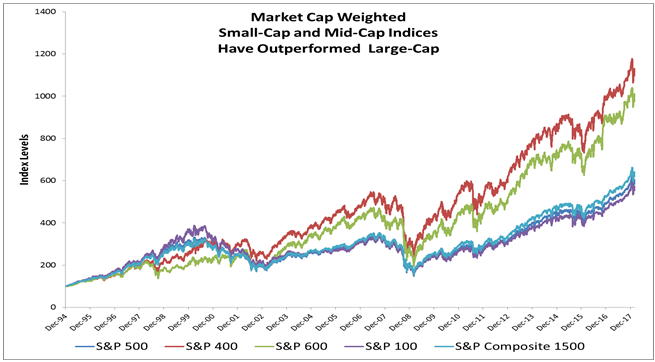
Source: S&P Dow Jones Indices, LLC. Index levels from Dec 31, 1994 as of close of business March 6, 2018
The S&P MidCap 400 and the S&P SmallCap 600 are constructed similarly to the S&P 500 with market capitalization ranges between $1.6 and $6.8 billion for mid-cap and between $450 million and $2.1 billion for small-caps. While there is still representation across the 11 sectors, and the financials and technology still add up to around 40% in the midcap index, the weights in the two sectors are much more evenly split. Also, the top ten holdings only make up about 7% of the S&P MidCap 400 that is much less than the 20% of the S&P 500 constituted by its top ten. The S&P Smallcap 600 concentration is similar to the mid-cap but the technology sector continues to shrink, replaced by industrials. Together the industrials and financials make up about 35% of the small-caps and the top ten are still about 7% of the index.
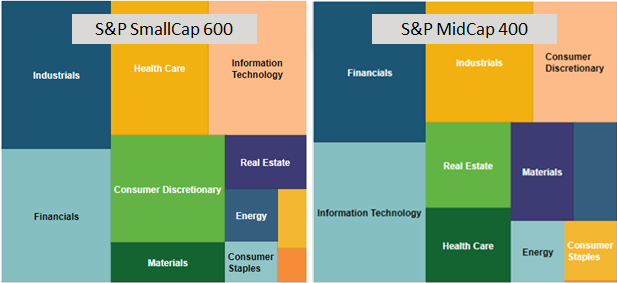
Source: S&P Dow Jones Indices, LLC. As of close of business March 8, 2018
These indices are both more well diversified than the S&P 500, and contribute to the S&P 500 Equally Weighted Index returns versus the 500 itself. Equally weighted indices have a smaller market capitalization mathematically so have outperformed the market cap weighted indices over the long-term. Simply, the S&P equally weighted indices for their respective sizes use the universe from relevant the market cap universe and allocate 100%/(n stocks) weight to each stock, then rebalances quarterly. For example, the S&P 500 Equal Weight Index rebalances quarterly to equal weight each stock in the S&P 500 at the company level of 1/500 = 0.02%.
This results in an index with a concentration as a result of the number of stocks rather than by market capitalization. The top ten amount to about 2.5% of the index while the consumer discretionary sector rises to the top of weights but with technology, industrials, financials and health care not far behind. The largest holding as of March 7, 2018 was Netflix at 0.34%, which is a function of performance since the last quarterly rebalance. This is far more diversified than the top ten of the S&P 500 that make up over 20% with nearly 4% in Apple.
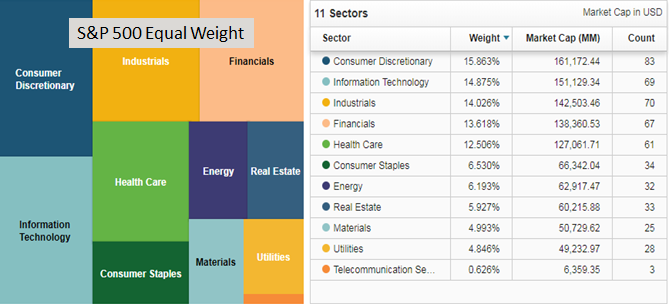
Source: S&P Dow Jones Indices, LLC. As of close of business March 07, 2018
The equally weighted indices across the sizes have outperformed their market cap weight counterparts in the long run, annualized over ten years. This is since the equally weighted indices have smaller market capitalization by the simple math of construction. This biggest impact naturally is from the large caps in the move from market cap weighted 500 to equally weighted 500 with a gain of 1.6% annualized.
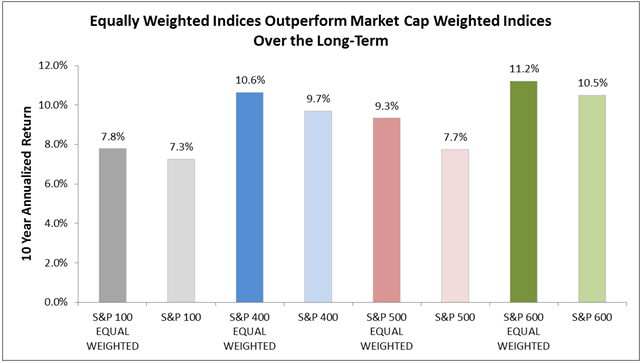
Source: S&P Dow Jones Indices, LLC. As of close of business March 7, 2018
Also, on average for most sectors the equally weighted outperformance is greatest for large caps. However, equally weighted technology midcaps have had a greater premium than the other sizes, while small-cap equally weighted had the highest premium for consumer discretionary and telecom. Telecom is harder to measure since there are barely any companies in the large and midcaps with only 3 large and 1 mid– as opposed to 9 in small cap. Also, the technology mid caps may have a bigger premium from the increased international business growth opportunities in that segment of the market. Technology has more international revenues than any other sector and the midcaps are big enough to go global but small enough to get new business growth.
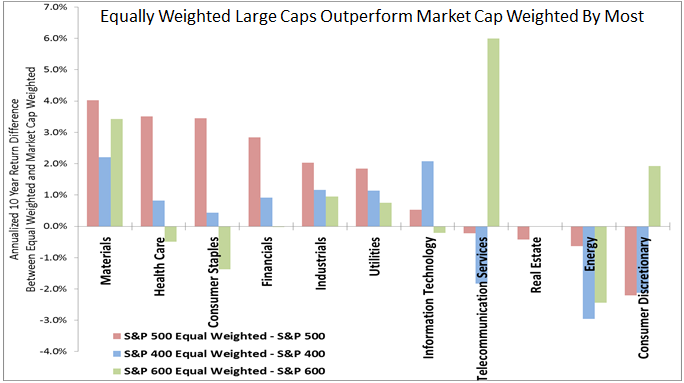
Source: S&P Dow Jones Indices, LLC. As of close of business March 7, 2018.
While on the whole the S&P 500 Equal weighted Index is more diversified and has provided a small cap risk premium, and this premium also holds for the majority of the sectors, it doesn’t hold for all. Sometimes larger size helps, depending on sector or market environment. For example, in energy, many of the larger energy companies hedge against falling oil prices, so in the past decade of fallen oil, the large companies may not have fallen as much with the price of oil. On the flip side, when oil rises, the same unhedged companies that are smaller (if they survived the downturn) will probably rise more than their bigger and better hedged counterparts. Though smaller companies can be more nimble, there are instances where larger size is useful for purchasing power or distribution.
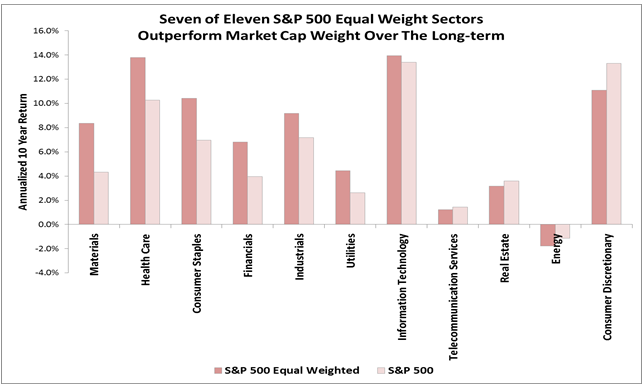
Source: S&P Dow Jones Indices, LLC. As of close of business March 7, 2018.
Lastly, when looking at the performance annually, there are specific periods where the S&P 500 equal weight outperforms the S&P 500. This generally happens in cycles and has fundamental underpinnings that support smaller stocks. Interesting times when equal weights underperformed have been in the financial crisis when smaller companies were beaten down by the credit environment, and recently last year when the market was anticipating Trump’s tax cuts but were delayed so the excitement over small caps diminished. In 2017, large caps have outperformed small caps by the most since 1999, which historically does not hold.
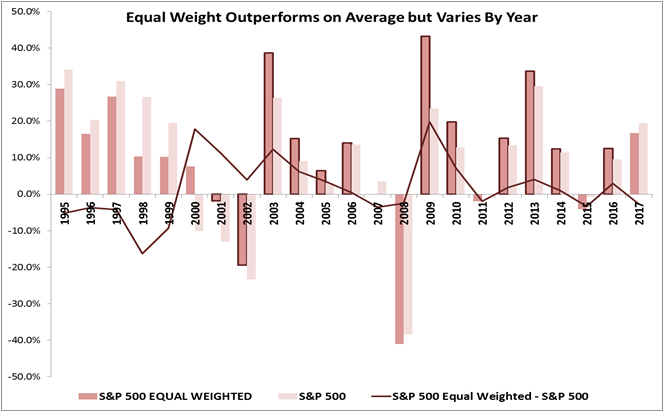
Source: S&P Dow Jones Indices, LLC. As of close of business Dec. 29, 2017.
In an environment where rising interest rates, accelerating growth, possibly rising inflation and a falling dollar are in place, it may help small and mid caps, especially in energy, financials, materials and information technology. The equally weighted indices may be a good choice for smaller cap exposure without making a separate small-cap allocation.
Copyright © S&P Dow Jones Indices