
It still amazes me how market sentiment can turn on a dime. A week ago, it looked like March would see investors mainly focusing on economic data and monetary policy in the run up to Jerome Powell’s first meeting as Fed Chair later this month.
Instead, March to date has been dominated by investors waking up to the potential that President Trump’s tough talk on trade (which had been manly talk to this point) over the last two years could explode into a full blown trade war that could have big ramifications for the global economy and the stock market. The President’s plans to implement tariffs on steel and aluminum entering the US has upset major trade partners and sparked talk of retaliation.
External risks like North Korea or what could happen to the Euro have been ignored by US investors over the last year and even interest rate hikes have been seen as playing out over a long period of time. A potential trade war, with real, immediate implications for US companies like higher costs at home and reduced access to markets abroad, have sent stock markets lower, increased volatility and jolted investors out of the complacency that had set in over the last year.
In this issue of Equity Leaders Weekly, we take a look at how inflammatory trade talk has impacted markets through its effect on the Canadian Dollar. We’ll also explore how the SIA Charts Sector Scopes tool highlights changes in relative strength in stock markets.
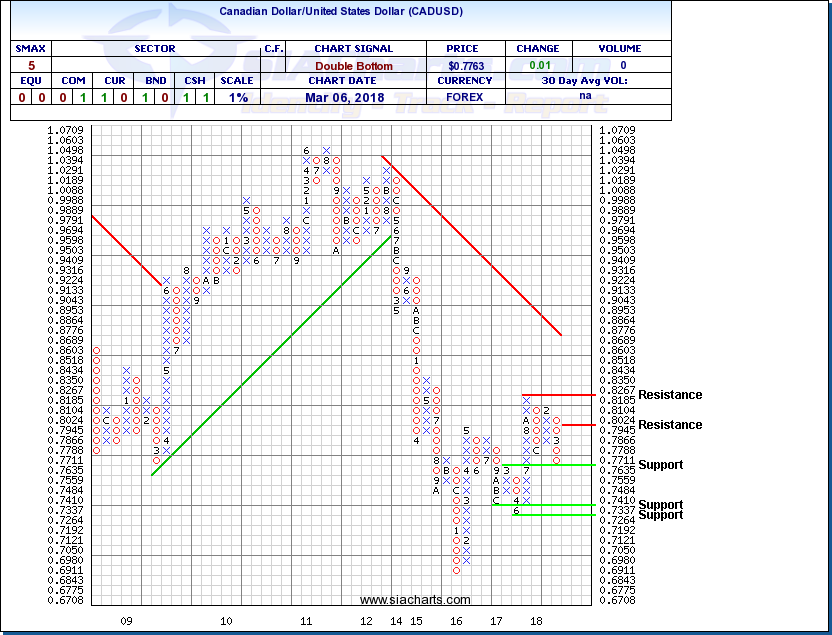
Canadian Dollar / US Dollar (CADUSD)
The risk that US-Canada trade could be disrupted has been growing for the last year between NAFTA renegotiations, and the rekindling of disputes over softwood lumber, dairy products and airplane subsidies. The risks to Canada of a White House hawkish on the trade file kicked up another gear this week with the planned tariffs on Steel and Aluminum striking right at Canada which is the largest foreign supplier of both commodities to the US.
In its latest statement, the Bank of Canada indicated “trade policy developments are an important and growing source of uncertainty for the global and Canadian outlooks”. This suggested that even through the Canadian economy has been doing well, Governor Poloz may slow the pace or even stop rate hikes until there is more clarity on where Canada stands in its critical trade relationship with the US.
The risks of a trade war to the Canadian economy and the prospect of a less hawkish Bank of Canada have combined to send the Loonie lower. CADUSD has been turning downward since peaking short of $0.8267 resistance first falling back under the $0.8000 level and then more recently taking out $0.7711 to complete a bearish Double Bottom pattern. The pair is currently testing former resistance as support but a break of $0.7635 would confirm the start of a new downleg. Should that occur, the next potential support zone may appear in the $0.7264 to $0.7337 area where a measured move coincides with previous support tests.
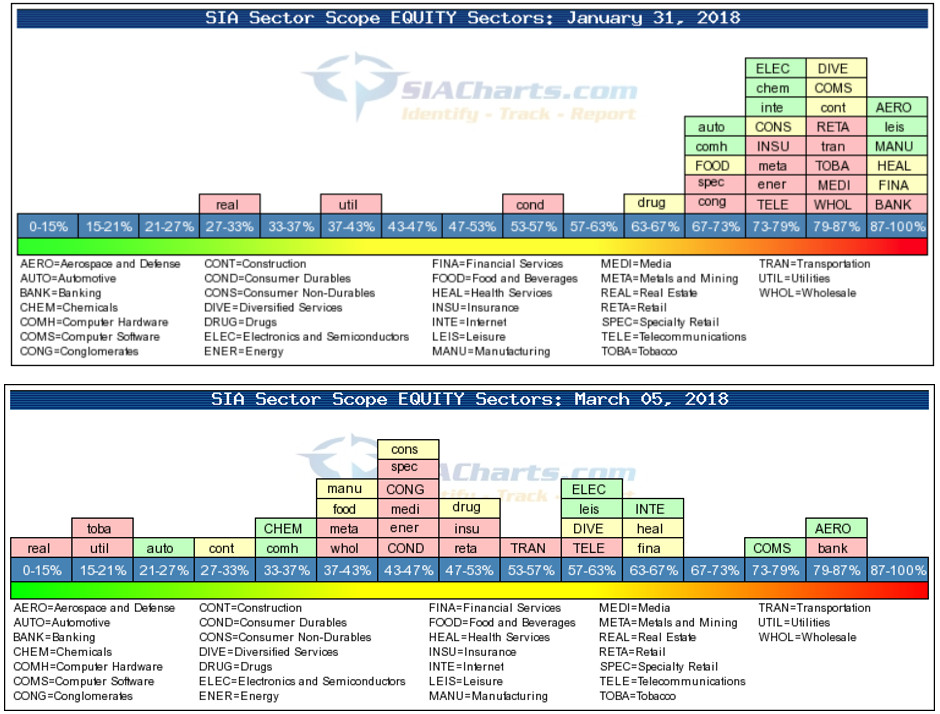
Sector Scopes
The SIA Charts Sector Scopes reports provide us with a visual reference of money flows between industry sectors in the stock markets. Comparing snapshots provide insights into how relative strength within the investment cycle is evolving.
The Sector Scopes measure the bullish percent (percentage of stocks within a group on Point and Figure Bullish signals) for 31 different industry groupings. These reports highlight the strength of different groups relative to each other. Sector Scope reports for January 31st, before the big market correction and today, show how much the investing environment has changed over the last six weeks.
At the end of January, nearly all of the sector groups were bunched up at the high end of the spectrum. This indicated that the bull market of 2017 had been driving nearly all areas higher, but also an overconcentration of bullishness that left stocks vulnerable to the correction that ensued.
The Sector Scope Report for March 5th, on the other hand is indicative of a more normal stock market with groups widely dispersed across the spectrum. This suggests that the tone of the market has shifted from one where most stocks are going up and investors can benefit from just holding the index to a market that favours relative strength analysis, sector rotation and stock picking strategies.
Looking at where certain groups have landed in the Bullish Percent spectrum can also tell us a lot about the nature of the current market.
First, look at how interest rate sensitive groups like Real Estate and Utilities have moved even farther over to the left side (low Bullish Percent) of the spectrum over the last month. This is normal in a rising interest rate environment and indicates that investors expect central banks like the US Fed to continue raising interest rates this year. This suggests that other interest rate sensitive groups may also be vulnerable. Although Banks have remained close to the right side among the strongest relative performers, Financial Services, and Insurance have been dropping down and moving left.
Second, the more recent Sector Scope reports shows how the potential for a trade war has started to impact stock prices. In particular, look at the Auto sector. In a strong economic environment, one would expect sectors sensitive to the economy like autos to be doing well and among the stronger relative performers. Instead, autos are near the left among the weaker performers. This suggests that investors are concerned that higher tariffs and any retaliatory measures they spark could increase their costs, impact demand and disrupt their supply chains. In contrast, sectors like Computer Software and Internet where trade is more difficult for governments to control or influence, remain among the stronger relative performers on the right hand side.
SIACharts.com specifically represents that it does not give investment advice or advocate the purchase or sale of any security or investment. None of the information contained in this website or document constitutes an offer to sell or the solicitation of an offer to buy any security or other investment or an offer to provide investment services of any kind. Neither SIACharts.com (FundCharts Inc.) nor its third party content providers shall be liable for any errors, inaccuracies or delays in content, or for any actions taken in reliance thereon.
For a more in-depth analysis on the relative strength of the equity markets, bonds, commodities, currencies, etc. or for more information on SIACharts.com, you can contact our sales and customer support at 1-877-668-1332 or at siateam@siacharts.com.