


The Equity markets continued trading rather choppy towards the end of last week after the very volatile trading from the week prior. Having said that, stabilization seems and wants to return to the market these last few days. Last week we looked at the US main index, the Dow Jones Industrial Average, so this week we have decided to take a look at Canada’s broad market Index, the S&P/TSX Composite Index to see what has materialized in the chart in the last little while. We will also look at the Crude Oil Continuous Contract as this is an important commodity for the S&P/TSX Composite Index given its significantly large exposure to resource names.
Crude Oil Continuous Contract (CL.F)
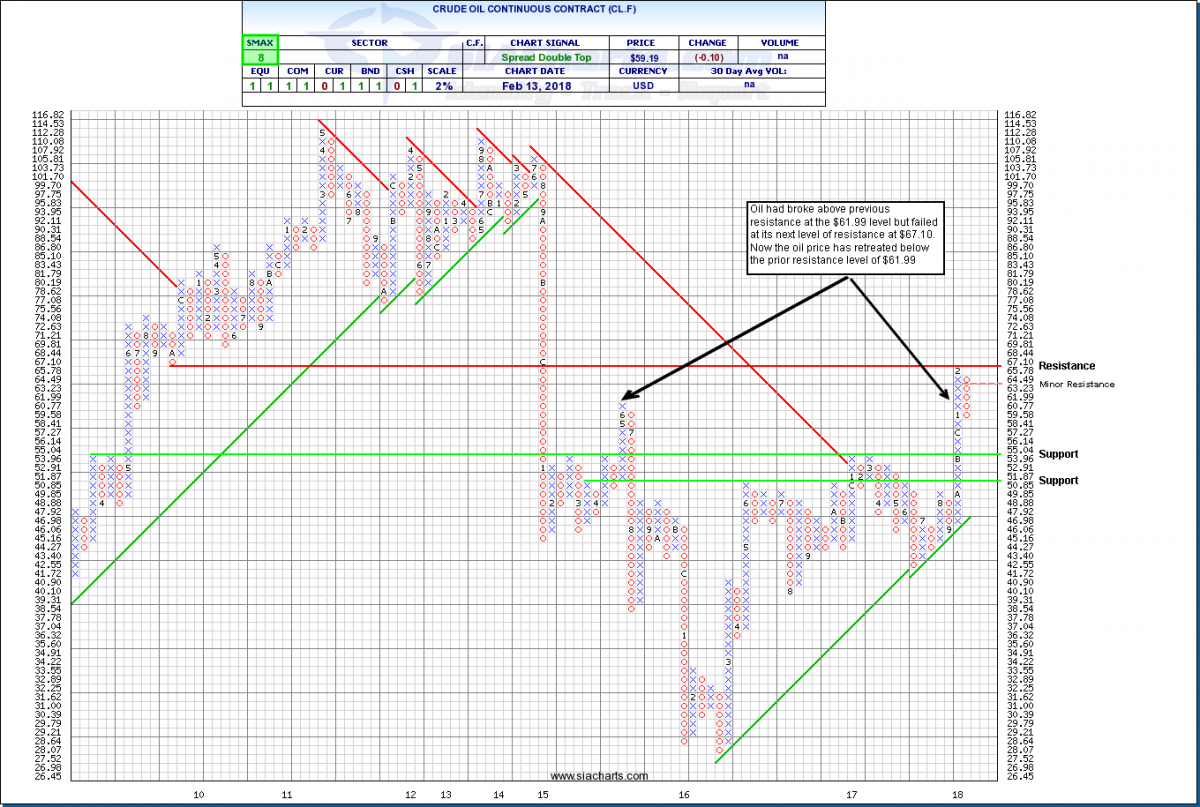
We last looked at the Crude Oil Continuous Contract (CL.F) on Jan 4th. Since that time, we see that oil had broken past an important prior resistance level at $61.99 but failed to beak past the next prior resistance point of $67.10.
The most recent oil inventory numbers reported by the American Petroleum Institute stated that US crude inventories rose by 3.9 million barrels in the week ending Feb. 9th. Analysts had expected inventories to rise by 2.8 million barrels. Furthermore, the International Energy Agency, also indicated that supply could outstrip demand, moving forward. This can be attributed to the soaring US crude production and drilling activity of late. The latest numbers show that US production has increased by more than 20% since the middle of 2016 to more than 10 million barrels per day in November which is more than OPEC’s top producer, Saudi Arabia. Meanwhile, Baker Hughes reported 791 active oil drill rigs last week which is up from 591 a year ago and the highest levels since April of 2015. Some industry followers predict that the US may soon become the most influential producer in the oil market.
Let's further examine the attached chart of CL.F to see what may materialize in the coming days and weeks. As previously mentioned, CL.F failed to break above its prior resistance level of $67.10 and a 3-box reversal has now formed. There appears to be long term support at $53.96. If it cannot maintain this support level, the next support level below that is the psychological $50.00 level. To the upside, resistance can be found at $64.49 and, above that, the recent high near $67.10. With an SMAX of 8 out of 10, Crude Oil is still showing near-term strength against most asset classes.
S&P/TSX Composite Index (TSX.I)
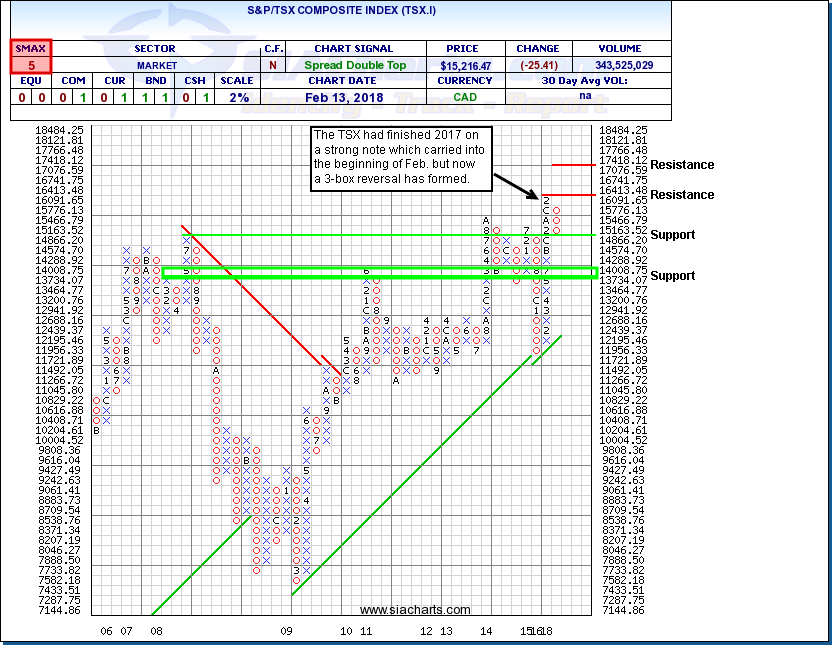
The last time we looked at the S&P/TSX Composite Index was back on November 2, 2017. From November to January, all was calm on the equity front as many major equity markets around the world were achieving new all-time highs. Market volatility returned to the forefront in February so let’s examine the price movement of the TSX.I to see what has transpired.
In analyzing the attached chart of the TSX.I we see that, like the Dow chart from last week, the TSX.I had ended 2017 strong and this strength continued until the beginning of February. In the past week and a half a 3-box reversal to the downside has formed. It is quickly approaching the first level of support at 14,866.20 and, below that, further potential support at the 14,000 area. To the upside, resistance can be found at the recent high of 16,413.48. If strength manages to reassert itself, the next level of resistance beyond that is 17,418.12.
As the equity markets continue to regain stability, it will be interesting to see moving forward what direction the TSX Composite will resolve itself to. With an SMAX score of 5 out of 10, the TSX.I is only showing near term strength against one asset class.
As we know, the S&P/TSX Composite Index has a significant weighing towards resource sector names. Needless to say, the price action of commodities such as oil could have an impact on which direction the index will resolve itself to. As with any Relative Strength comparison, it is important to keep in mind the other equity opportunities outside of Canada. The U.S. and International equity classes continue to be Favored in SIA’s Asset Class Rankings which may provide a better risk/reward benefit going forward.
*****
SIACharts.com specifically represents that it does not give investment advice or advocate the purchase or sale of any security or investment. None of the information contained in this website or document constitutes an offer to sell or the solicitation of an offer to buy any security or other investment or an offer to provide investment services of any kind. Neither SIACharts.com (FundCharts Inc.) nor its third party content providers shall be liable for any errors, inaccuracies or delays in content, or for any actions taken in reliance thereon.
For a more in-depth analysis on the relative strength of the equity markets, bonds, commodities, currencies, etc. or for more information on SIACharts.com, you can contact our sales and customer support at 1-877-668-1332 or at siateam@siacharts.com.