Post Mortem
by Chris Metli, Executive Director, Institutional Equity, Morgan Stanley
February 6, 2018 - With a 4% drop in cash equities and even greater decline in futures, the VIX finally went bananas rising 20 points to the highest level since Aug 2015, and the weighted average 1-month VIX futures rose 96%. This creates more supply from systematic funds for the rest of the week and nearly bankrupted the inverse VIX ETPs with NAVs down 96%. To summarize the price action and implications:
- Some of the selling on Monday likely reflected investors anticipating systematic supply on Tuesday – this means the $30 to $35bn QDS estimates for sale Tuesday (detailed below) may net down to $15 to $25bn. This is still enough to have negative impact on markets though and will be compounded by dealer short gamma positions.
- Anticipation of further supply later in the week from both annuities and risk parity funds could bring in more fast money sellers Tuesday.
- The near bankruptcy of the inverse VIX ETPs will be a very negative headline, and the several billion dollar loss for holders, largely retail, will scare some out of the market or force liquidations of other products to raise cash.
- Institutional vol sellers will likely cover exposures as well in the coming days and weeks. While these positions will not take losses on the same scale of the VIX ETPs (because they are generally scaled more conservatively) unless there is a quick snap back many investors will likely take down risk, supporting implied volatility in the process.
- On the positive side, much of the short gamma exposure in the VIX market has been wiped out, leaving less risk of a further volatility spike from here.
- Investors were not in panic mode despite the selloff, as this move has ‘only’ wiped out one month of P/L. As noted earlier in one sense this is good as it might slow discretionary supply, but it also highlights that discretionary investors are still very long risk and could easily turn sellers.
- Who are the incremental buyers here? Macro funds betting on the vol unwind that has now happened could cover and turn buyers, but for real support the market needs deep pocket asset allocators to step in. Vol target supply will eventually wane as volatility peaks and/or leverage comes down, but they likely remain sellers for the next several days.
- Net-net more supply likely pushes markets lower Tuesday and potentially Wednesday, and buyers will need to see signs of slowing supply and stabilization to come back in. Short-dated implied volatility has likely peaked, while the back end of the vol curve likely rises over the next week and realized volatility will continue to move higher. This is unlikely the turn of the cycle as the selloff is largely technical and positioning driven, and likely not large enough to feed back into the real economy and become fundamental, so dips will be bought after the systematic supply and vol unwinds abate.
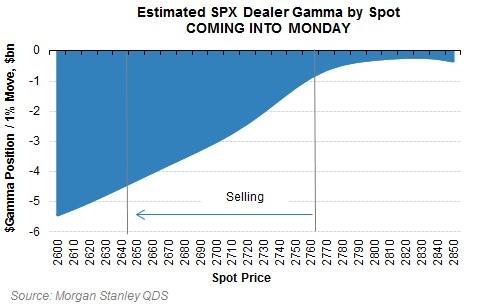
QDS came into Monday expecting nearly $5 to $10bn of equity supply from systematic funds, principally annuities as they tend to react quickest to recent increases in realized volatility. That supply likely contributed to the move lower, but it was then compounded by dealers having to hedge their short gamma exposures. QDS estimates that in total dealers likely had to sell $11bn of S&P 500 futures on the way down today.
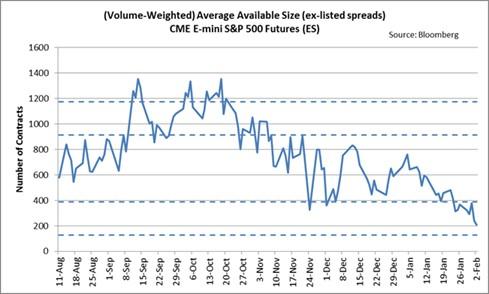
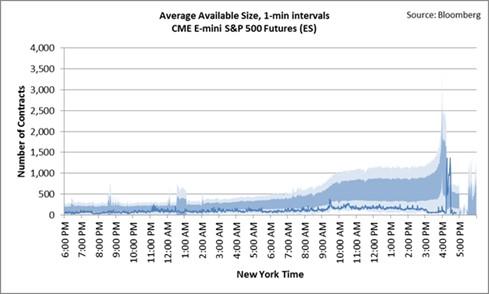
The selling was exacerbated by a lack of liquidity – as the MS Futures team has noted, available size in ES futures has been deteriorating this year (left chart below) and it dried up sharply Monday afternoon with average available size at the top of the book falling to ~75 contracts between 3:30 and 4:00 pm versus typical levels between 500 and 1000 seen last year.
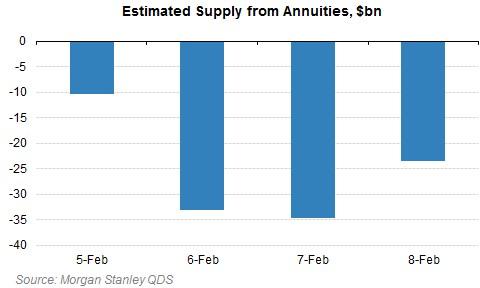
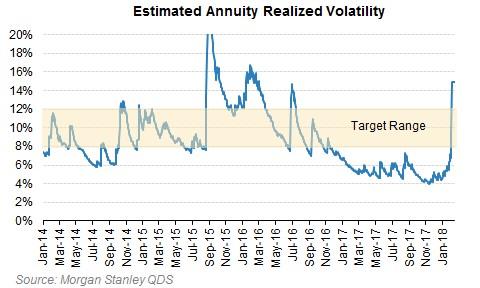
After this violent move lower, QDS estimates that annuity funds will now need to sell between $30 and $35 bn of equities on Tuesday, and a similar amount Wednesday. Realized volatility has moved through most funds’ target ranges, so this is the point of max pain, but further volatility from here could still add to the supply picture for later in the week.
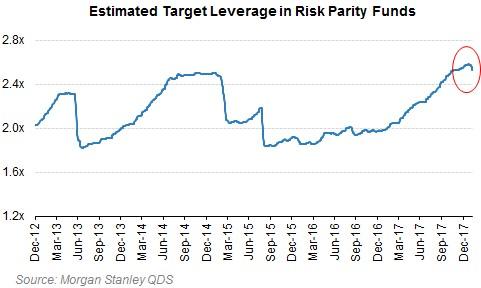
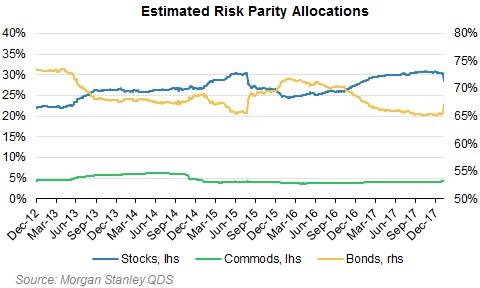
As noted in previous pieces, risk parity funds were likely not sellers yet. But that is now at risk of changing since despite the rally in bonds today, it was likely overwhelmed by the selloff in equities, and realized volatility for risk parity portfolios is now starting to rise. Timing and sizing this flow is not as clear as for annuity funds, but if the actual deleveraging follows QDS models, there could be $10 to $20bn of supply in both equities and bonds later this week. The flight to safety in bonds will certainly help slow any deleveraging and keeps the tail scenario of stocks and bonds falling together off the table, but near-term they could still be modest sellers given the increases in volatility across asset classes.
The VIX market saw the net buying pressure on record. For background on the risks that materialized Monday see If the VIX Goes Bananas, this is What it Might Look Like from July 2017. Details and implications:
- The ETPs had to buy 282,000 VIX futures to rebalance their short gamma… needless to say this is the largest VIX buy in history, dwarfing Friday’s previous record of 78,000. Dealers hedging their short gamma exposures likely contributed to VIX futures demand as well.
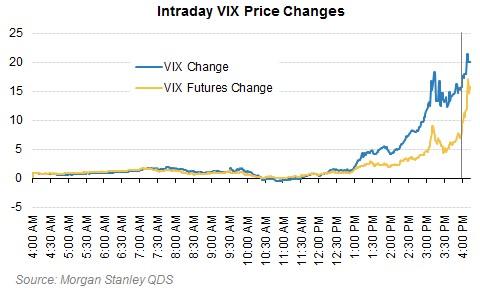
- Most of the rally in VIX futures happened after the 4:00 pm cash close, not leaving a lot of time for investors or the issuers of the VIX ETPs to react.
- This move was incredible particularly because VIX and VIX futures were already elevated – and the amount of volatility to buy exceeded QDS estimates (below shows what QDS estimated coming into Monday) and speaks to the size of the short vol exposures in the market:
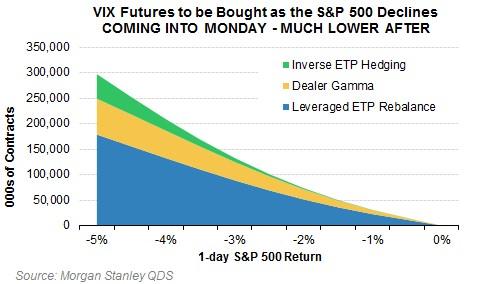
- Whether the inverse ETPs continue to exist tomorrow is up for debate at time of this writing (contact us for details), but for the broader market the implication is clear: the inverse ETPs have effectively delevered down to zero, going from short 230,000 VIX futures to short just 4,000. (note exact numbers will need to be updated to reflect creations / redemptions reported overnight).
- On a positive note this means there is much less risk going forward of further vol to buy from rebalancing of these products. On a negative note holders of the inverse ETPs lost $3.4bn as the products went nearly bankrupt and this removes a steady source of volatility supply over the last year.
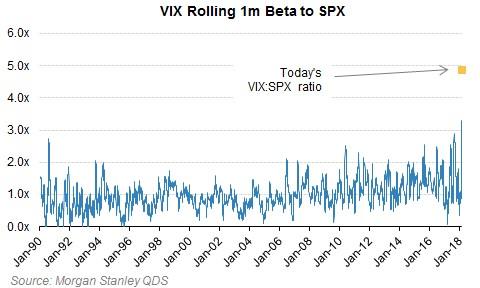
The VIX move of 20 was massive relative to the SPX selloff of 4%, pushing the rolling 1-month beta of VIX to SPX to all-time highs. Prior to 4pm the VIX futures move had been relatively modest versus the move in VIX, but that rapidly changed post close as VIX futures rallied nearly 80% as much as VIX spot – a rare occurrence as the ratio is usually 40-50% – as the massive 280k futures that had to be bought had an impact.
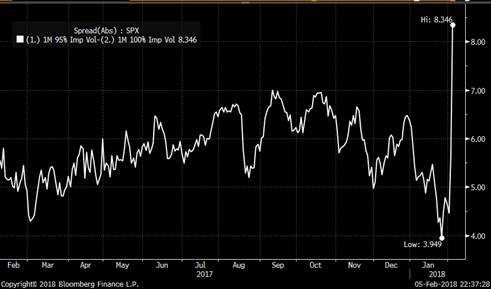
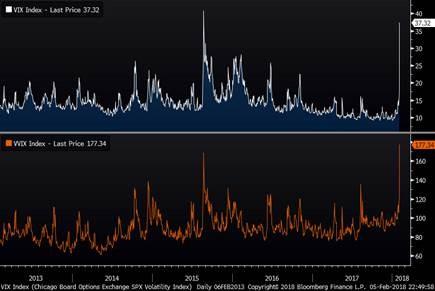
Prior to the VIX futures explosion post cash close, the bid to the front of the term structure and massive steepening of skew was reflective of the pain dealers likely felt from the move lower in spot, forcing them to cover their short vol positions with short dated options (impacting VIX more than longer-dated vols) – as noted previously skew was too flat given the large short downside vol exposures dealers were sitting on. Demand to cover short convexity risks also drove VVIX (the implied volatility of VIX to a record high of 177%, outpacing even the large move in VIX.
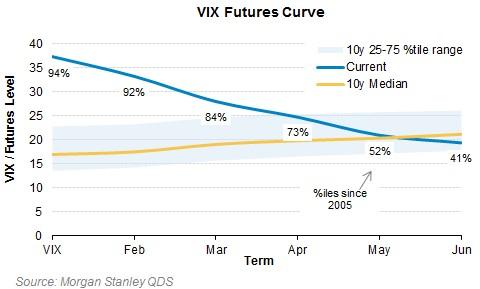
Even though Feb and March VIX futures caught up late day, longer-dated VIX futures lagged and June VIX futures are actually still trading below 10 year medians. This is typical behavior in a sharp selloff – the cheapest dollar price / shorter dated options get bid first, and only after investors begin to expect the higher vol environment to persist for longer do they buy longer-dated options to hedge. Given that today’s move up in vol and skew was led more by dealers repricing risk than end user demand for puts, longer-dated volatility should reprice higher in the coming days. Shorter-dated vols are already off their closing levels, retracing some of the post cash close bid.
Copyright © Morgan Stanley