
In light of the Bank of Canada's decision to raise interest rates another quarter point yesterday, we will first look at the CADUSD chart and then take a look at the relationship between Canadian Long-term Bonds vs. Short-term Bonds and how these recent interest rate moves have affected the long end of the yield curve.
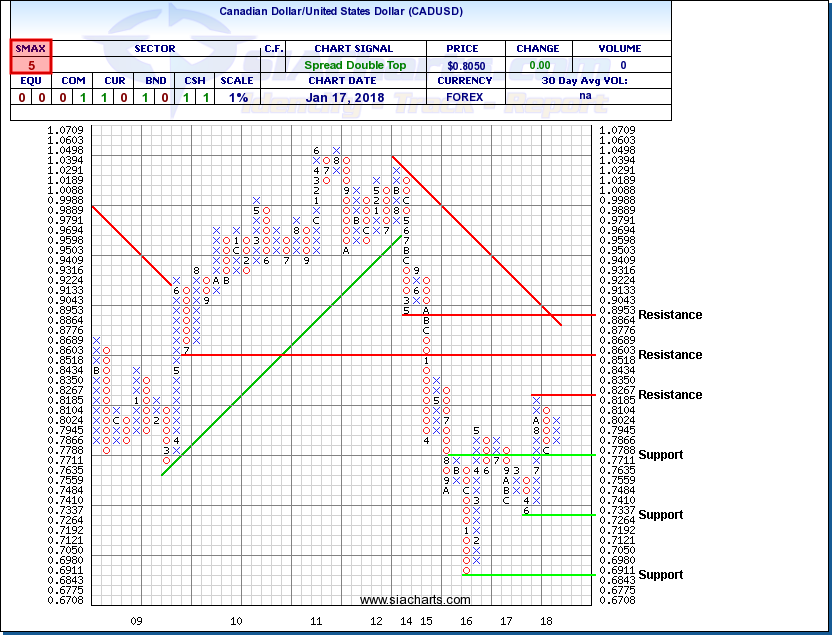
Canadian Dollar/United States Dollar (CADUSD)
Yesterday, the Bank of Canada (BoC) led by Governor Stephen Poloz increased the benchmark overnight rate another quarter-point to 1.25%; a statement issued from the BoC explained that "recent data have been strong, inflation is close to target, and the economy is operating roughly at capacity,". Then, even with the followup dovish language used and the cautious tone looking forward, speculation from some forecasters are that we are in store for three additional quarter-point rate hikes for 2018. However, the elephant in the room is the growing risks around NAFTA negotiations which depending on the outcome will have major economic implications for Canada, and BoC decisions.
Looking at the chart of the Canadian dollar versus the US, which is an inverse of the USDCAD, we can see that yesterdays bump in interest rates didn't have a dramatic influence on the currency pair. Perhaps the rally that took place at the end of December fully priced in this move as well as the speculation going forward. A positive NAFTA outcome could be the catalyst to move this Loonie past resistance through 0.82 and potentially 0.85. On the other hand, any negative news on the NAFTA front, and or further dovish comments from the BoC could push the currency down toward support at 0.77 and possibly even further down, below 0.73 This will be a very interesting chart to watch over this first quarter, and for the rest of 2018. With an SMAX of 5 out of 10, CADUSD continues to show some near-term weakness versus the asset classes.
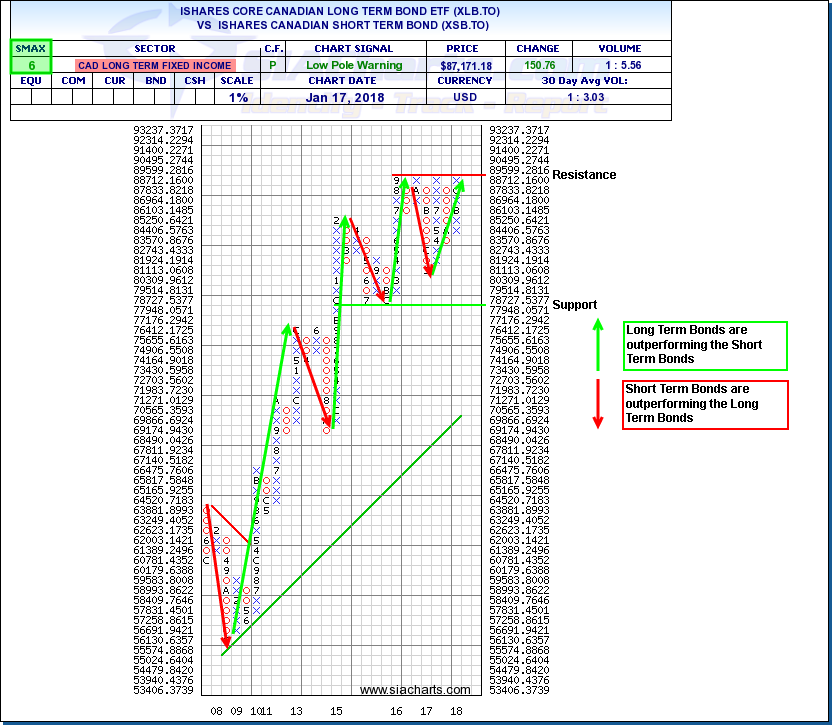
iShares Core Canadian Long Term Bond ETF (XLB.TO) vs. iShares Canadian Short Term Bond ETF (XSB.TO)
Let's now look at the comparison chart for the iShares Core Canadian Long Term Bond ETF (XLB.TO) vs. iShares Canadian Short-Term Bond ETF (XSB.TO). This comparison chart can give us insight in the market's risk appetite in fixed income securities as longer maturities generally have higher risk in a rising interest rate environment. With yesterdays Bank of Canada rate increase coupled with a cautionary tone going forward, we didn't see the weakening of the long term bond versus the shorter duration as one might have expected; in fact it went in the opposite direction. And contrary to the anticipatory move that we saw with the currency, the recent trend had favored the long term bonds as you can see with the most recent column of X's. Watch for some major break-outs to take place in 2018 for this comparison chart whether its the long-term bonds overtaking the short-term bonds by eventually breaking through resistance on its now 4th attempt, or a strong move down favoring the short duration bonds.
Looking closer at the attached chart, let's focus on what has been occurring since the market meltdown of 2008. As a reminder, a rising column of X’s indicates Long-term Bonds are outperforming Short-term Bonds and a declining column of O’s indicates Short-term Bonds are outperforming Long-term Bonds. As you can see since June of 2009, Long-term Bonds have outperformed Short-term Bonds for the most part in an upwards trend. There were a few brief periods where Short-term Bonds outperformed its long -term counterparts but those brief out-performances were followed by another strong column of X’s where Long-Term bonds regained leadership. Looking at last year and a half, we are in a tight consolidation pattern and the tug-a-war for a clear winner probably isn't that far away. Currently we are sitting with an SMAX score of 6 out of 10 which at this time slightly favors the long term bonds but just like the CADUSD, 2018 will not be for the faint of heart
SIACharts.com specifically represents that it does not give investment advice or advocate the purchase or sale of any security or investment. None of the information contained in this website or document constitutes an offer to sell or the solicitation of an offer to buy any security or other investment or an offer to provide investment services of any kind. Neither SIACharts.com (FundCharts Inc.) nor its third party content providers shall be liable for any errors, inaccuracies or delays in content, or for any actions taken in reliance thereon.
For a more in-depth analysis on the relative strength of the equity markets, bonds, commodities, currencies, etc. or for more information on SIACharts.com, you can contact our sales and customer support at 1-877-668-1332 or at siateam@siacharts.com.