by Ryan Detrick, Senior Market Strategist, LPL Research
Yesterday, the S&P 500 Index price return surpassed 20% for the year, which could be the first 20% gain since 29.6% in 2013. What does that mean, other than the obvious answer that stocks had a great year? Per Ryan Detrick, Senior Market Strategist, “One might think the year after a 20% gain tends to be weak, as the big gains are digested. But, the year after a 20% gain actually tends to be stronger than the average year.”
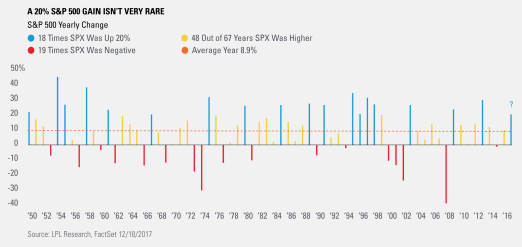
Since 1950 there have been 18 years that saw a 20% gain, and incredibly the next year was higher 16 times (83.3%) with an average return of 11.2%.* Compare that with the overall average year seeing the S&P 500 up 8.9% with positive returns 71.6% of the time, and it is clear that banking on weakness the year after a 20% gain may not be the best plan.
So how rare is a 20% gain? Turns out they aren’t all that uncommon, as over the past 67 years (since 1950) there have been 18 years that finished up at least 20% (26.9% of the time). Considering that 19 years during the same period saw negative returns, you could argue the likelihood of a single year finishing in the red is nearly the same as a year finishing up 20%.
As it turns out, big returns aren’t quite as unusual as they might seem, and history would say a 20% gain in 2017 would only add to the odds that the bull market continues in 2018.
IMPORTANT DISCLOSURES
* Please note: The modern design of the S&P 500 stock index was first launched in 1957. Performance back to 1928 incorporates the performance of its predecessor index, the S&P 90.
Past performance is no guarantee of future results.
The economic forecasts set forth in the presentation may not develop as predicted.
Investing in stock includes numerous specific risks including: the fluctuation of dividend, loss of principal and potential illiquidity of the investment in a falling market.
The Standard & Poor’s 500 Index is a capitalization-weighted index of 500 stocks designed to measure performance of the broad domestic economy through changes in the aggregate market value of 500 stocks representing all major industries.
This research material has been prepared by LPL Financial LLC.
To the extent you are receiving investment advice from a separately registered independent investment advisor, please note that LPL Financial LLC is not an affiliate of and makes no representation with respect to such entity.
Not FDIC/NCUA Insured | Not Bank/Credit Union Guaranteed | May Lose Value | Not Guaranteed by any Government Agency | Not a Bank/Credit Union Deposit
Securities and Advisory services offered through LPL Financial LLC, a Registered Investment Advisor Member FINRA/SIPC
Tracking #1-679121 (Exp. 12/18)
Copyright © LPL Research


