
DECEMBER 2017
Minus Inflation and Leverage, a Bear Market Doesn’t Add Up
Inflation and leverage are key drivers for the timing and severity of any down cycle.
by Jurrien Timmer, Director of Global Macro, @TimmerFidelity, Fidelity Investments Canada
Key Takeaways
- Historically, rising inflation is often what forces the Federal Reserve (Fed) to raise interest rates to the point of inverting the yield curve and eventually causing a recession.
- Once an economic expansion ends, however, the amount of built-up leverage (debt used to buy assets) in the financial system typically helps determine how bad a subsequent down.turn might be.
- At this point, with inflation running well below the Fed’s 2% target and a lack of widespread leverage, the conditions for a nasty bear market are just not there.
Inflation + leverage = trouble
In my view, the two key drivers that will signal when the U.S. expansion and bull market are ending—and how bad any subsequent downturn might be—are inflation and leverage.
The typical emergence of inflation in the late stage of an economic cycle is what usually forces the Fed’s hand in terms of the speed and magnitude of its rate-tightening cycle. If inflation pressures become bad enough to force an excessive amount of rate hikes, what often follows is an inversion of the yield curve (i.e., short rates rise above long rates). This typically curtails the availability of credit, which eventually (six to 12 months later) causes the economy to contract and a bear market to start.
A lack of inflation can mean an extended Goldilocks environment for stocks, as has been the case for some time now. If this changes, it may mean that the Fed will have to seriously tighten financial conditions. Accommodative liquidity has been one of the two powerful tailwinds (the other being strong earnings growth) propelling equity valuations higher since 2009 and especially since the first quarter of 2016, so a reversal of that tailwind would be a significant development. If inflation reveals whether an expansion is going to end, the amount of leverage in the system can indicate how bad the subsequent downturn could be. Excessive leverage can lead to forced selling and a liquidity crisis, which is what could turn an ordinary downturn into a crash. It’s forced selling that helped create the kind of severe downturn we saw during the 2008 financial crisis.
So, where do these two drivers stand today? Inflation remains very low, so unless it sharply accelerates from here, it’s unlikely to turn the ongoing expansion and bull market into a contraction and bear market.
Of course, this also depends on the speed and magnitude of the Fed cycle. One way to illustrate this is to compare the “real” federal funds target rate (using core PCE, or consumption expenditures prices excluding food and energy) to the so-called natural real rate of interest, or R*. “R-Star” is the rate that would keep the economy operating at full employment and stable inflation, and when the demand for capital is in equilibrium with the supply of capital. A Fed easing cycle tends to drive the real funds rate down to well below R*, and a tightening cycle tends to produce the opposite effect.
This can be seen in Exhibit 1, where the blue shading shows the difference between the real funds rate (black line) compared with R* (blue line). You can see that leading up to the dot-com peak in early 2000, the real rate was several hundred basis points above the natural rate. That was enough to invert the yield curve and eventually cause a bear market for stocks. You can see that a corporate deleveraging started soon after rates climbed too far above R*. The same thing happened in 2007, leading up to the global financial crisis.

So where are we today? Fortunately, right now the real policy rate is pretty much equal to the natural real rate, leaving the system in balance. If we assume that the market (via the fed funds forward curve) is correct in pricing in a 2% rate over the next two years and that inflation will gradually rise to 2%, then that will still leave us at a 0% real rate in two years, which is where R* is right now. So no harm, no foul, if the market is correct.
However, if the Fed’s so-called “dot plot” (depicting all 16 Federal Open Market Committee members’ individual projections of where the policy rate will be) is accurate in suggesting seven more hikes, plus factoring in the tightening effects of the projected $1.25 trillion decrease in the Fed’s balance sheet over the next three years, then the funds rate could be closer to 4%, which would be +2% in real terms. If R* is still at zero then, that could be enough to cause a downturn. However, my view is that the Fed will only go there if R* is trending higher. This is how I’m thinking about the whole Fed cycle.
Leverage
The next chart (Exhibit 2) is an attempt to illustrate where the so-called leverage air pockets or “bubbles” are. It shows the change in leverage or asset concentration over time, expressed as the percentage point increase relative to gross domestic product (GDP). It shows changes in corporate leverage, household leverage, financials sector (banks) leverage, and government debt.
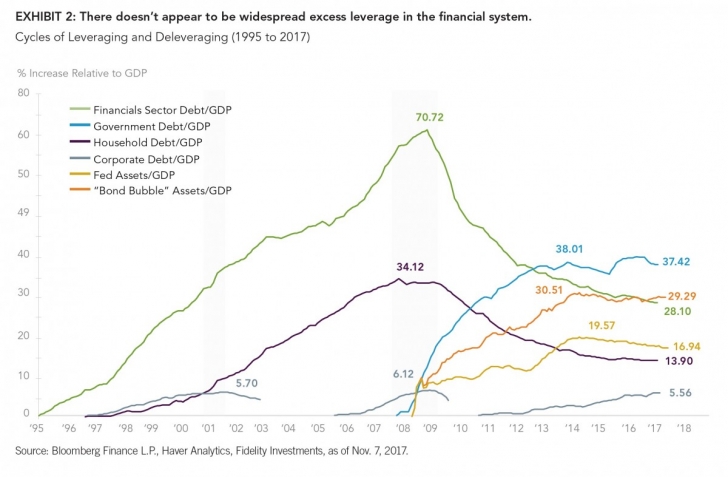
I also show the change in the Fed’s balance sheet (as a percentage of GDP), as well U.S. bond mutual funds and ETFs (which added $1.2 trillion in flows, arguably as a consequence of the Fed’s policies). I realize that these are assets and not liabilities, but I’m trying to show the various potential air pockets of forced selling out there. To many pundits, this is where the bubbles are these days.
What can we learn from this chart? A few things. Leverage in the non-financial corporate sector (gray line in chart) has recently increased from 40% of GDP to its previous cycle highs of 45% in both 2000 and 2007. There is also plenty of leverage in central bank balance sheets (“Fed Assets,” +20 percentage points of GDP since 2009), government debt (+37 ppts since 2008), and bond funds (+11 ppts of GDP). However, leverage in both the financials and household sectors has declined significantly since the financial crisis. Leverage in the financials sector is down roughly 40 ppts, while household leverage is down some 20 ppts.
When I add it all up, I see some pockets of excess leverage or asset concentration but certainly not a widespread excess. Plus, it should be remembered that neither the central bank nor the government will likely be forced to sell anything. Why is this important? Because in 2007, there was a massive buildup of household, financial sector, and corporate leverage that had to unwind during the financial crisis. It was a catastrophic trifecta of deleveraging. We don’t have those same conditions presently. We have government debt, corporate debt, and a much larger Fed balance sheet (which some people argue drove bond buying by the public), but those are offset by a significant deleveraging in household and financial sector debt.
The bottom line is that with neither inflation nor widespread leverage present in the system, we do not yet have the recipe for a downturn in the economic cycle.
Author
Jurrien Timmer | Director of Global Macro, Fidelity Global Asset Allocation Division Jurrien Timmer is the director of Global Macro for the Global Asset Allocation Division of Fidelity Investments, specializing in global macro strategy and tactical asset allocation. He joined Fidelity in 1995 as a technical research analyst.
For Canadian investors
For Canadian prospects and/or Canadian institutional investors only. Offered in each province of Canada by Fidelity Investments Canada ULC in accordance with applicable securities laws.
Unless otherwise disclosed to you, any investment or management recommendation in this document is not meant to be impartial investment advice or advice in a fiduciary capacity, is intended to be educational and is not tailored to the investment needs of any specific individual. Fidelity and its representatives have a financial interest in any investment alternatives or transactions described in this document. Fidelity receives compensation from Fidelity funds and products, certain third-party funds and products, and certain investment services. The compensation that is received, either directly or indirectly, by Fidelity may vary based on such funds, products and services, which can create a conflict of interest for Fidelity and its representatives. Fiduciaries are solely responsible for exercising independent judgment in evaluating any transaction(s) and are assumed to be capable of evaluating investment risks independently, both in general and with regard to particular transactions and investment strategies.
Information presented herein is for discussion and illustrative purposes only and is not a recommendation or an offer or solicitation to buy or sell any securities.
Views expressed are as of the date indicated, based on the information available at that time, and may change based on market and other conditions. Unless otherwise noted, the opinions provided are those of the author and not necessarily those of Fidelity Investments or its affiliates. Fidelity does not assume any duty to update any of the information.
Investment decisions should be based on an individual’s own goals, time horizon, and tolerance for risk.
Nothing in this content should be considered to be legal or tax advice and you are encouraged to consult your own lawyer, accountant, or other advisor before making any financial decision.
Stock markets, especially non-U.S. markets, are volatile and can decline significantly in response to adverse issuer, political, regulatory, market, or economic developments. Foreign securities are subject to interest rate, currency exchange rate, economic, and political risks, all of which are magnified in emerging markets.
Investing involves risk, including risk of loss. Past performance is no guarantee of future results. Diversification and asset allocation do not ensure a profit or guarantee against loss.
All indices are unmanaged. You cannot invest directly in an index.
Index definitions
Standard & Poor’s 500 (S&P 500®) Index is a market capitalization–weighted index of 500 common stocks chosen for market size, liquidity, and industry group representation to represent U.S. equity performance. S&P 500 is a registered service mark of The McGraw-Hill Companies, Inc., and has been licensed for use by Fidelity Distributors Corporation and its affiliates. Third-party marks are the property of their respective owners; all other marks are the property of Fidelity Investments Canada ULC.
If receiving this piece through your relationship with Fidelity Institutional Asset Management® (FIAM), this publication may be provided by Fidelity Investments Institutional Services Company, Inc., Fidelity Institutional Asset Management Trust Company, or FIAM LLC, depending on your relationship.
If receiving this piece through your relationship with Fidelity Personal & Workplace Investing (PWI) or Fidelity Family Office Services (FFOS), this publication is provided through Fidelity Brokerage Services LLC, Members NYSE, SIPC.
If receiving this piece through your relationship with Fidelity Clearing & Custody Solutions® or Fidelity Capital Markets, this publication is for institutional investor or investment professional use only. Clearing, custody or other brokerage services are provided through National Financial Services LLC or Fidelity Brokerage Services LLC, Members NYSE, SIPC.
© 2017 Fidelity Investments Canada ULC.
All rights reserved.
US: 813966.1.0 CAN: 826218.1.0