by Bryce Coward, Knowledge Leaders Capital
We’ve been arguing for the last year that US-based investors would be well served to overweight foreign versus domestic equities. In this post we’ll dig into that topic a little deeper to try to convey a few of the company specific fundamental drivers of our foreign vs domestic call, especially as they relate to one of our favorite markets: Japan. Readers should note that in each of the charts below we present bottoms up aggregated data (i.e. summed up from company financial statements) for the three developed market regions in our global equity universe, excluding financial companies. DM Americas (essentially the US) is represented by the dark blue line, DM EMEA is represented by the red line and DM Asia (essentially Japan) is represented by the light blue line. Our developed market global equity universe includes the largest 85% of listed equities in 22 developed market countries around the world, which is a similar methodology employed by the large index providers.
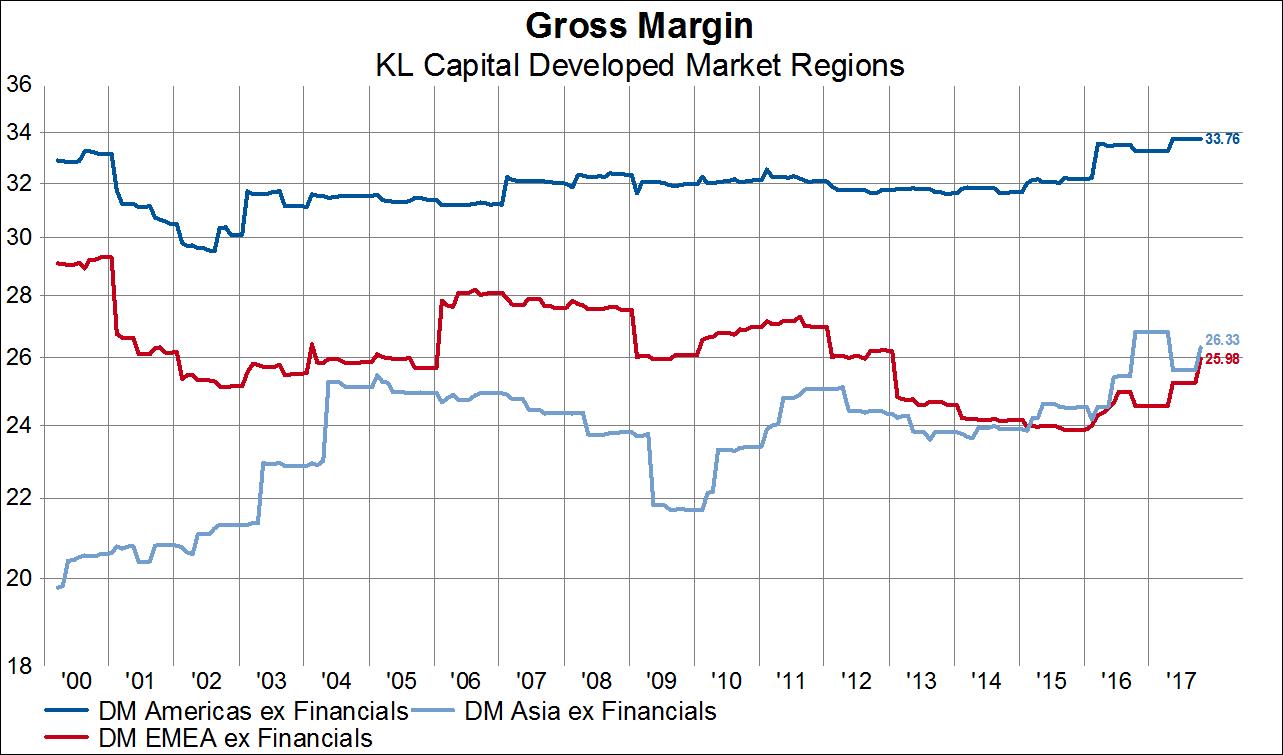
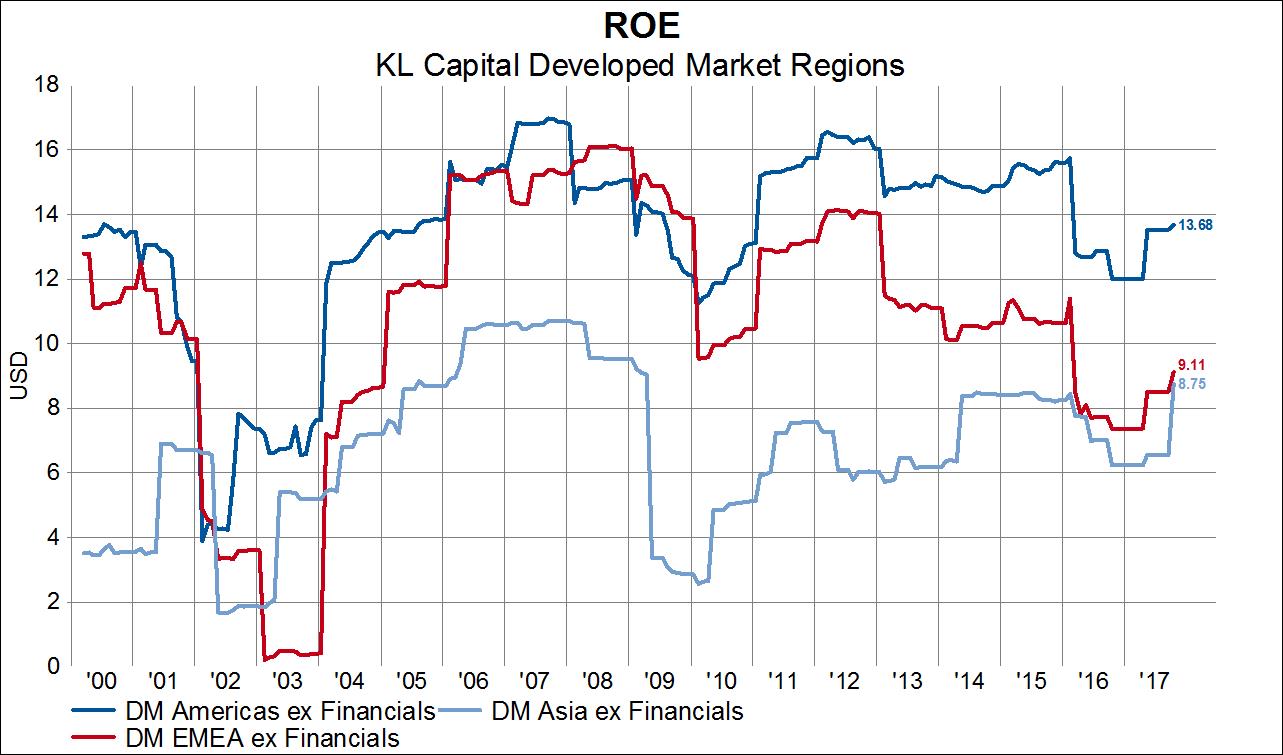
Over the last several years Japan has become a very interesting place to invest. Before we get into the whys and wherefores, let’s just start with the observation that margins and returns are structurally improving in Japan, but are structurally range bound or falling in the US and in Europe. The first two charts below depict the gross margin and ROE. The gross margin for Japanese companies has risen by 30% since 2000 and stands near an all-time high. The gross margin for American companies is range bound and that for European companies has fallen by 10% since 2000. Meanwhile the ROE for Japanese companies has more than doubled from 2000 levels compared to flat profitability for American companies and declining profitability for European companies.
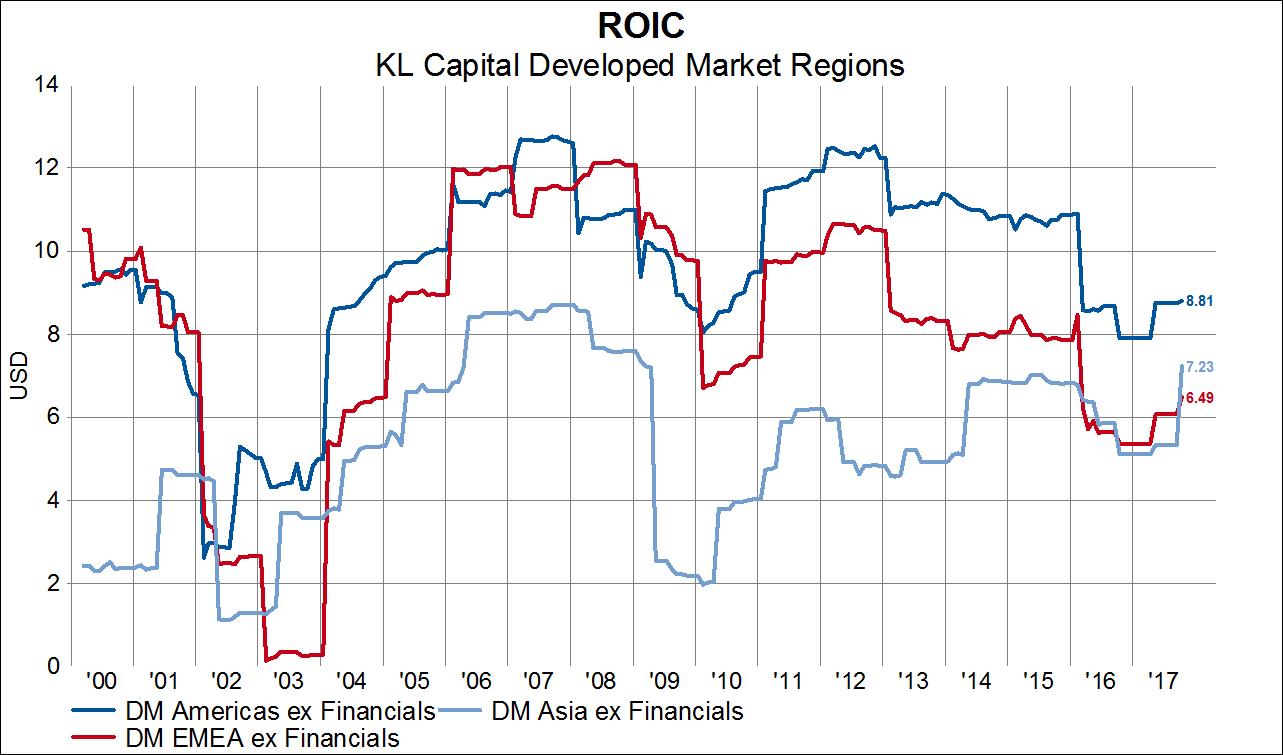
We also see stark differences in the productivity of the total invested capital stock (equity plus debt minus cash). The next chart shows ROIC and we can see that Japan has experienced more than a tripling of ROIC since 2000 compared to lower ROICs for each DM Americas and European companies.
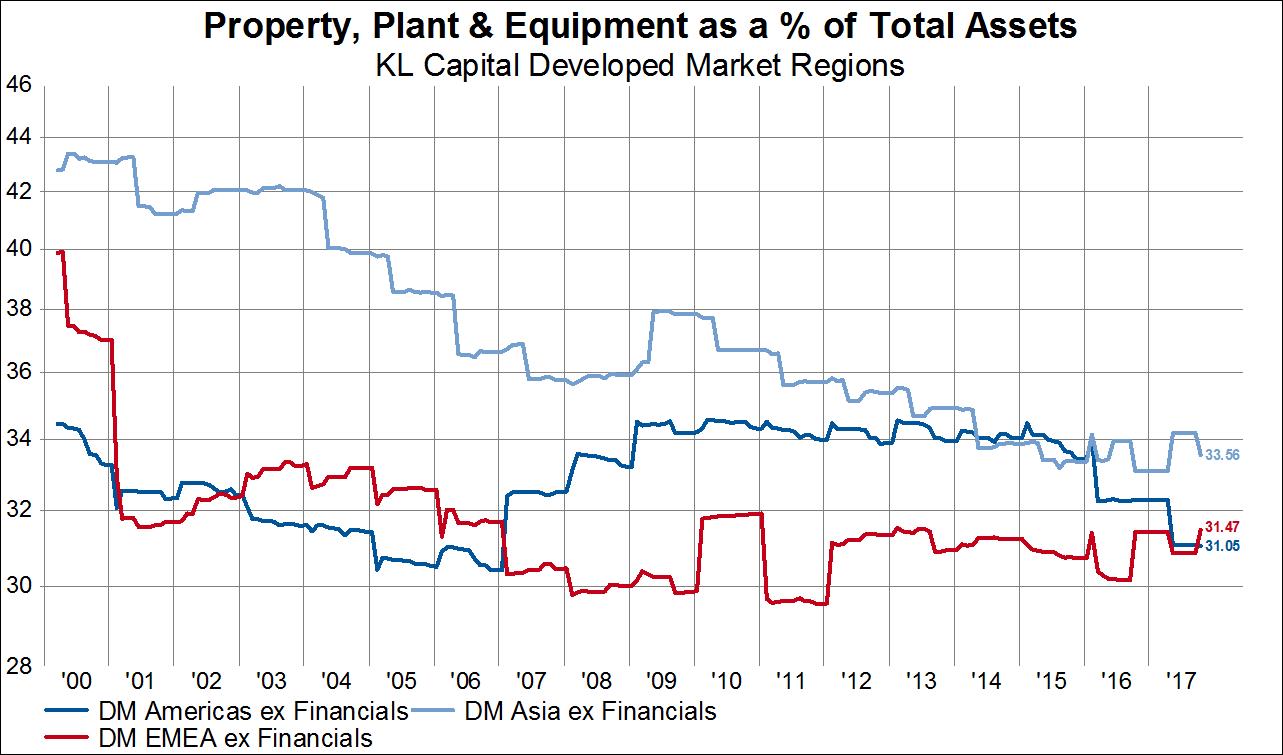
Part of the reason for improved capital stock productivity is that Japanese companies have aggressively right sized their fixed capital, transitioning from a lot of relatively less productive fixed capital to a smaller amount of relatively more productive fixed capital.
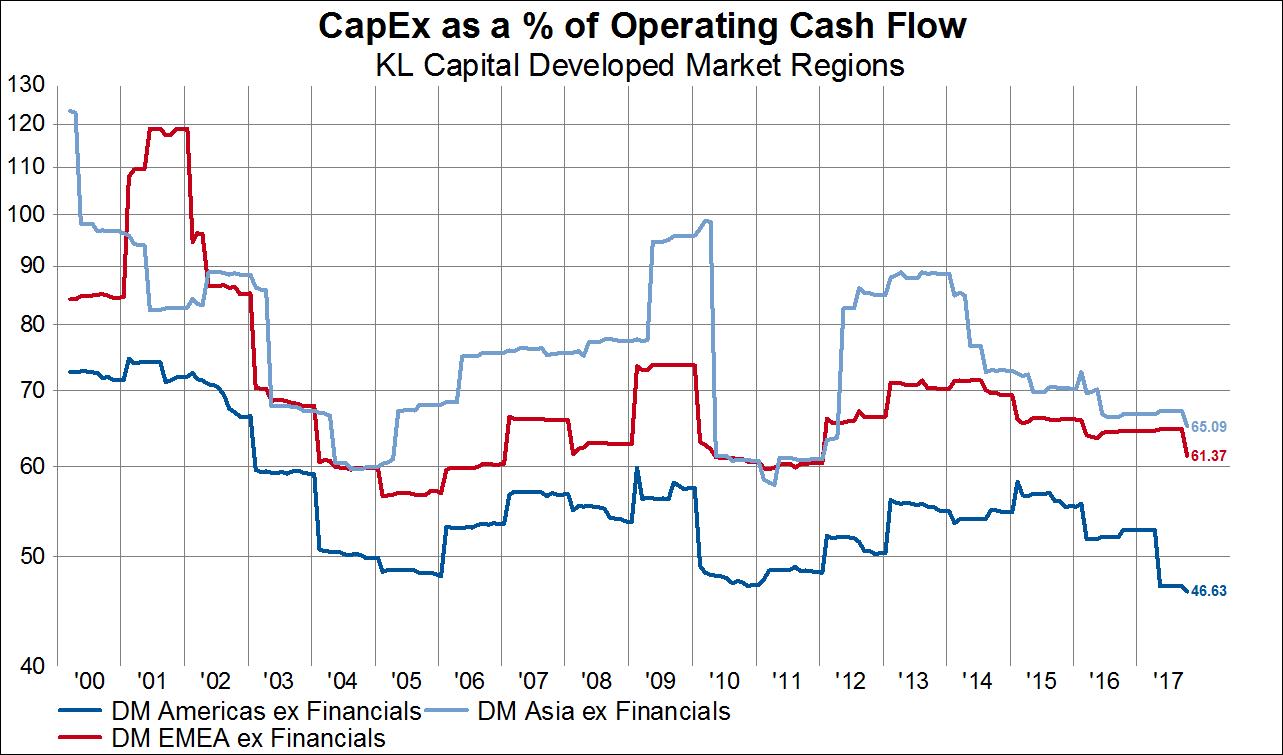
One of the benefits of this behavior is that Japanese companies are about half as capital intensive than they were in 2000, when capex accounted for 125% of operating cash flow. Today capex accounts for 65% of operating cash flow, comparable to that of European companies.
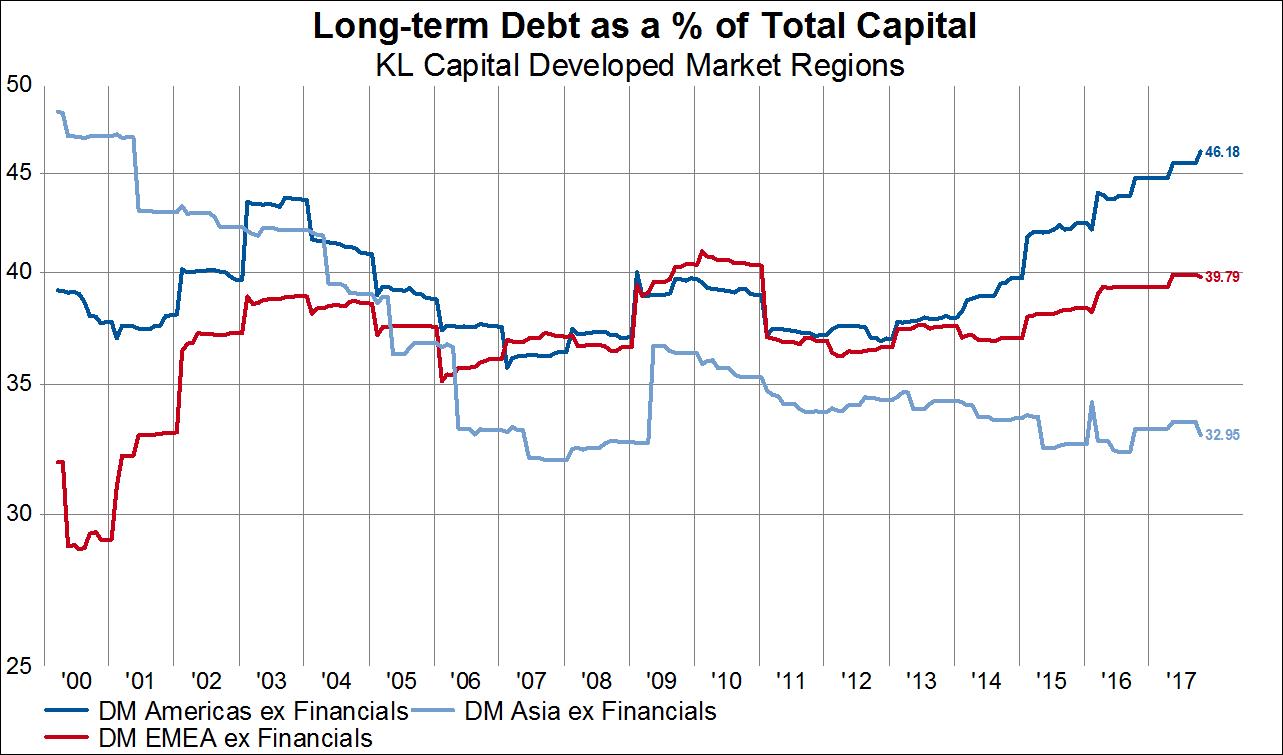
Consequently, when companies need to invest less in PP&E to achieve the same (or higher) level of return, it’s easy for balance sheets to become less leveraged. Long-term debt as a percent of capital for Japanese companies has fallen from 50% to 33% since 2000 while both American and European companies have experienced relentlessly rising debt levels, especially in the case of the US, and especially in the age of financial repression (more on that later).
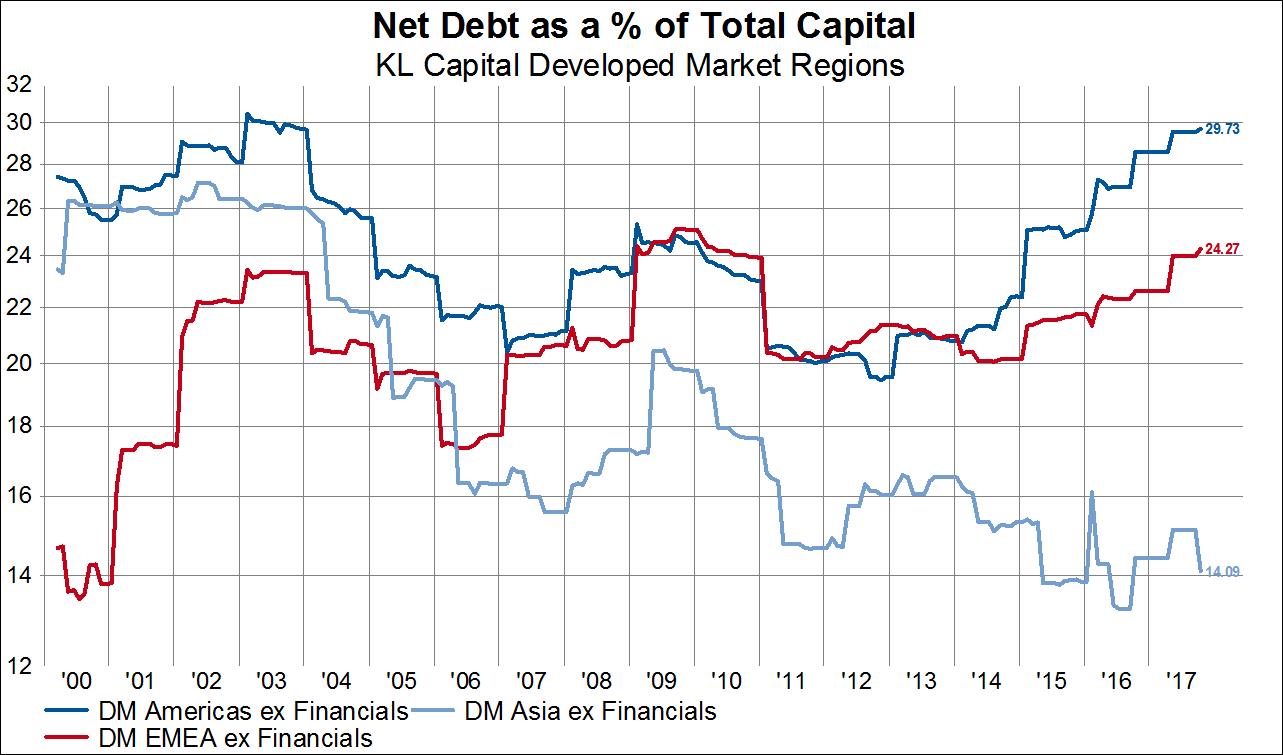
The deleveraging of Japanese balance sheets and the opposite leveraging of US and European balance sheets is even more apparent from a net debt perspective. Japanese net debt has fallen by 54% since 2000. Since 2011 US companies have added 50% net debt and the European counterparts have added 25% net debt.
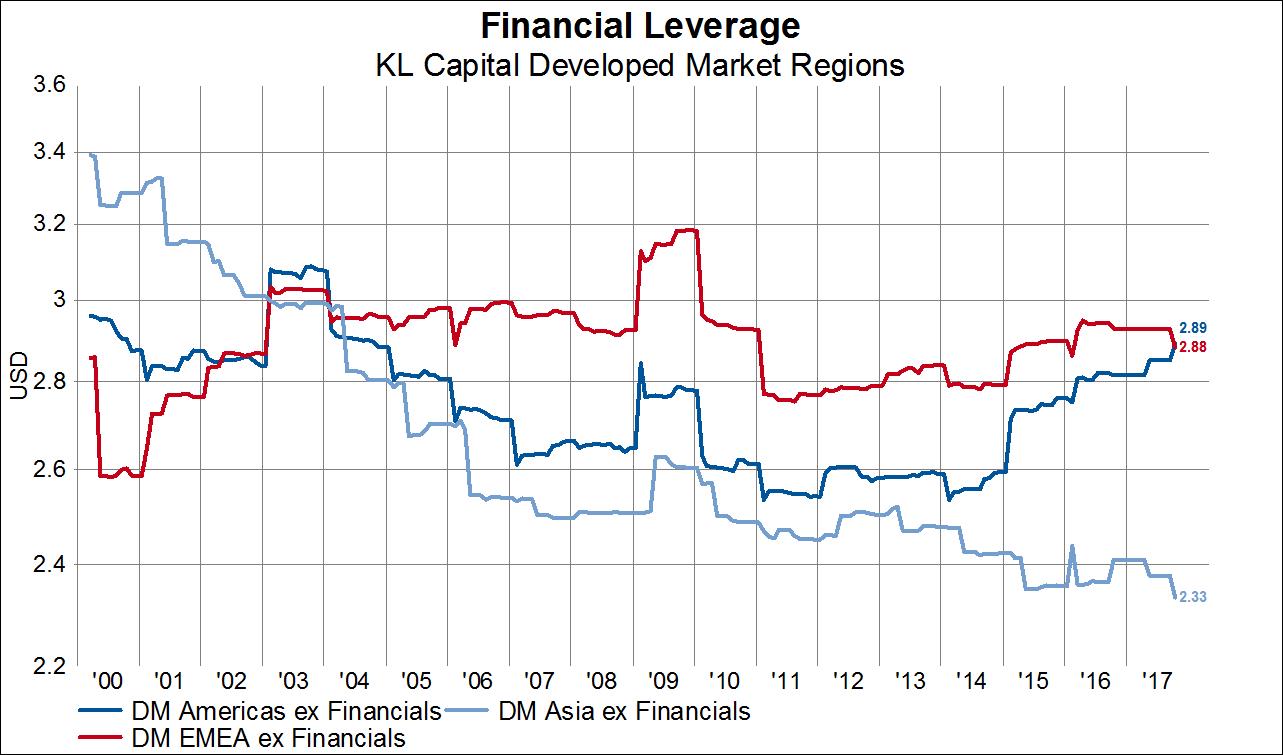
This brings us to financial leverage, or assets as a percent of equity. Given the above, this ratio must have necessarily fallen for Japanese companies and indeed it is in a persistent downtrend.
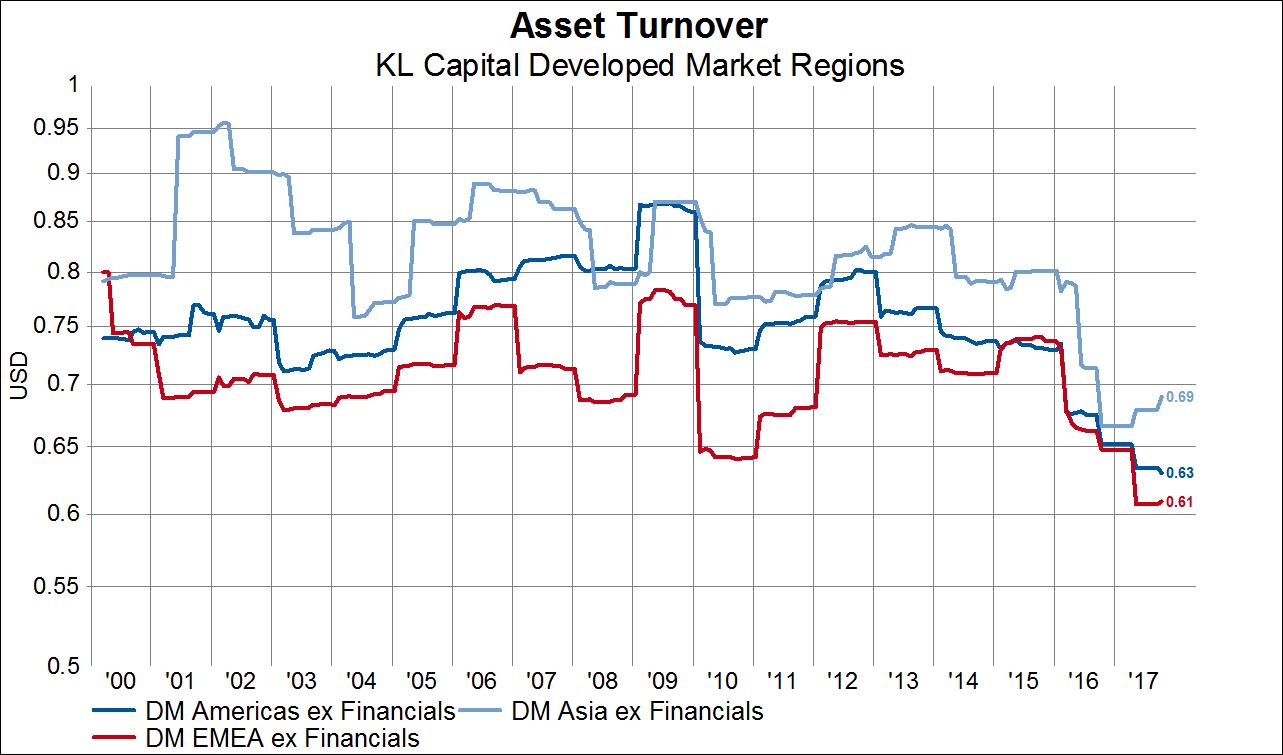
Asset turnover has been on a declining trend in all regions, but has declined less so in Japan than in other regions.
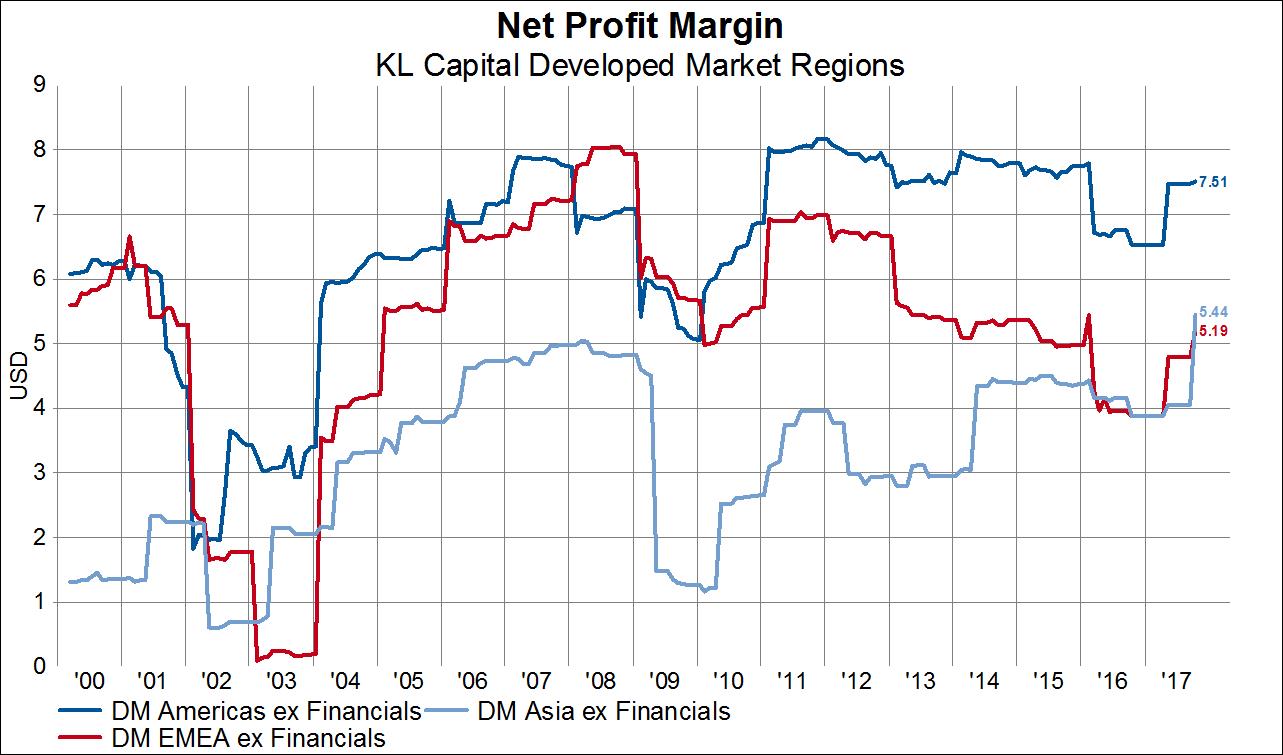
Meanwhile, net margins among Japanese companies have about quintupled to an all-time high compared to generally range bound or falling net margins for American and European companies.
Having explored the sources of returns for companies in various regions, let’s come back to the ROE chart we showed earlier. We noted that the ROE for Japanese companies has more than doubled since 2000, which is an easy observation. More interesting, however, is that ROE has doubled not by adding leverage to the balance sheet, to the contrary. ROE has doubled on the back of vastly improved margins that offset lower leverage. To risk conscious investors this may be viewed as a superior way to achieve a given level of return. We observe the opposite dynamic in the US and in Europe.
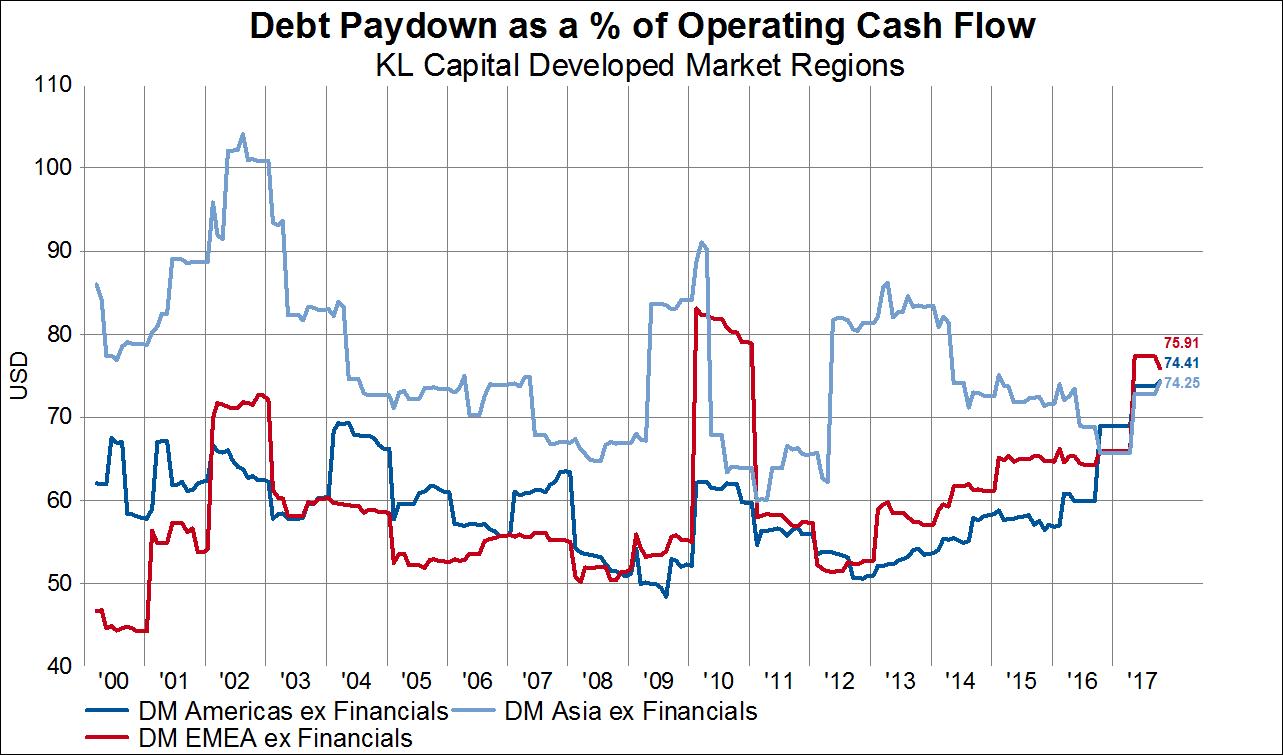
Let’s now move on to a quick analysis of the allocation of cash flow between the three regions. Observing what companies do with their cash flow tells us a lot about their priorities. We already showed that Japanese companies have cut fixed capital investment as a percent of operating cash flow, an action that actually padded margins. In lieu fixed capital investment, Japanese firms have, until recently, consistently used the highest percentage of operating cash flow among the regions to pay down debt. But, the most important observation here is that with debt levels at generational lows for Japanese companies, we should expect the debt paydown as a percent of operating cash flow to fall from here.
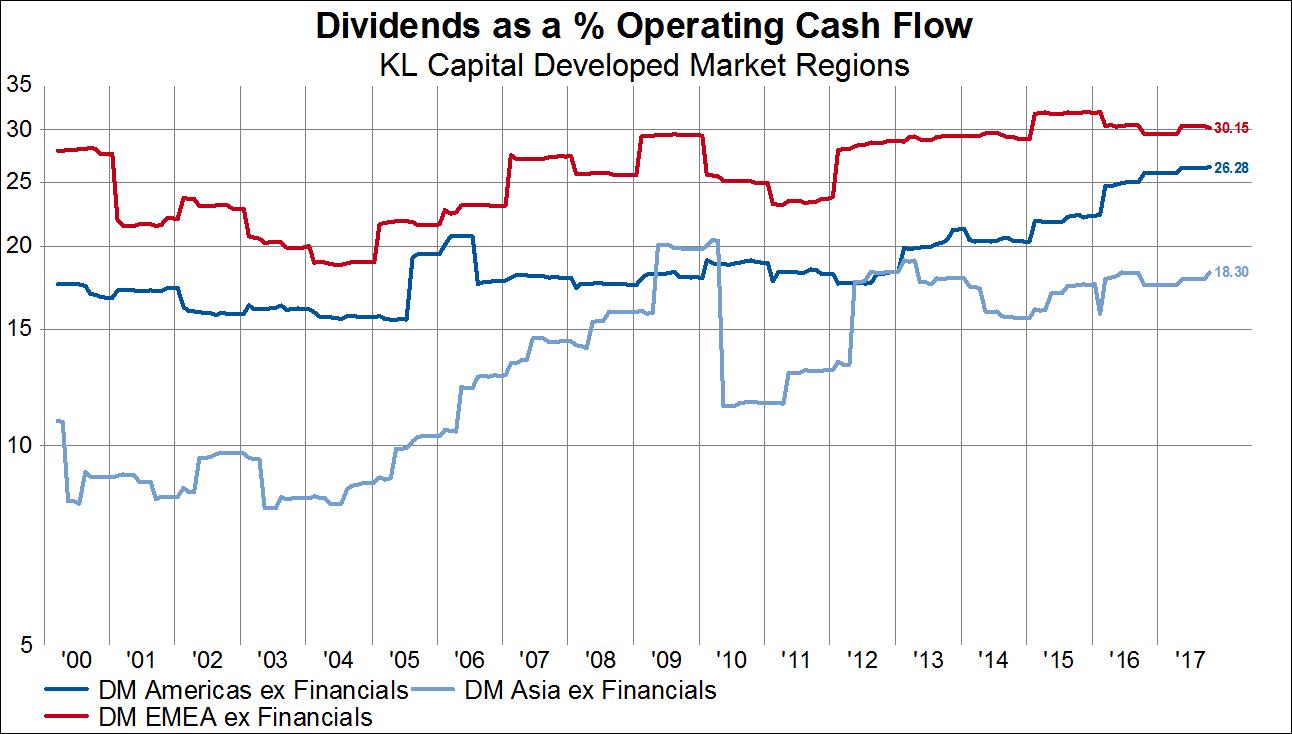
For Japanese companies, if operating cash flow isn’t used to repay debt, it can be used for other, more shareholder friendly activities. Japanese companies currently allocate the smallest portion of cash flow towards dividends compared to the US and Europe. The newfound health of Japanese firms could cause this to change over the coming years, which would be a massive positive for holders of Japanese shares.
The other observation about the chart below is that US and European companies are allocating quite a bit more operating cash flow towards dividends since 2011. To be precise, US firms have increased dividend payments as a percent of operating cash flow by 44% and European companies have raised it by 25%.
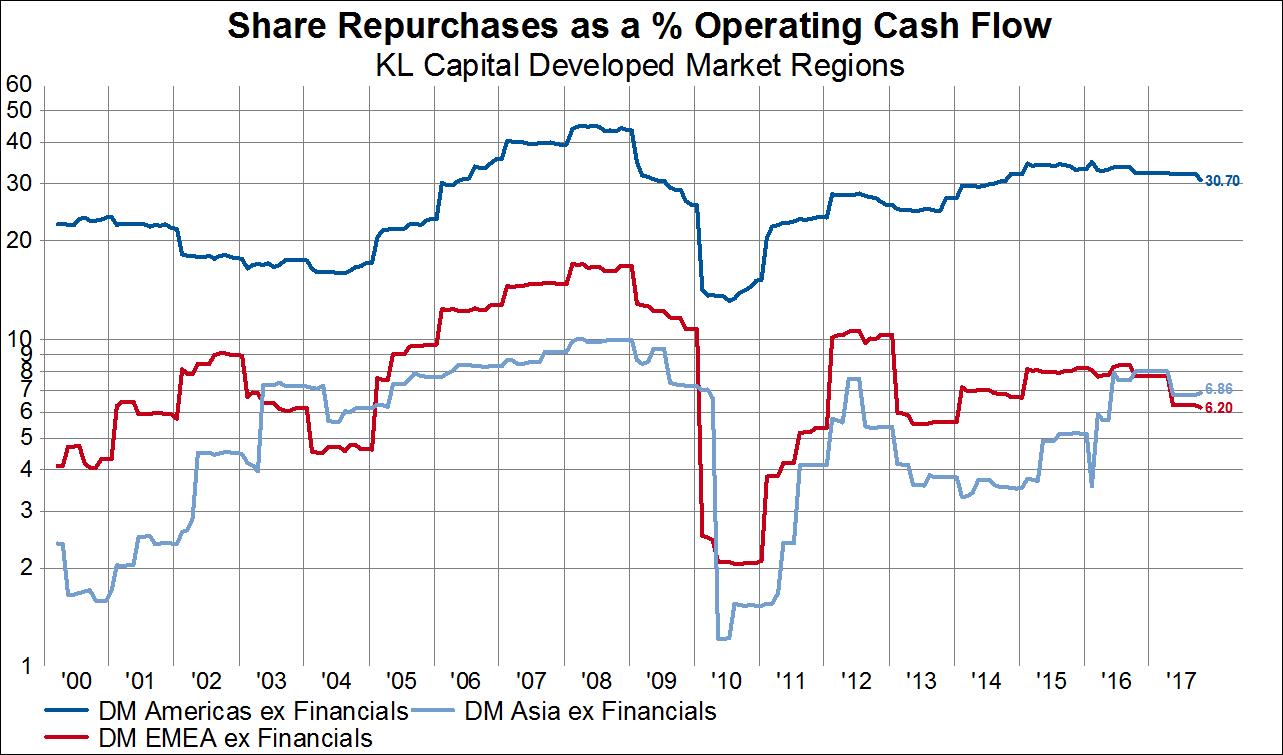
Meanwhile, Japanese firms remain laggards in terms of the operating cash flow allocated toward share repurchases, least compared to US firms. We aren’t necessarily the biggest fans of share buybacks, but it’s at least interesting to note that while US firms have increased share buybacks from 13% to 30% of operating cash flow since 2010, Japanese firms have raised it from 1% to just 7%.
Circling back to our financial repression comment, we can infer a certain set of priorities among the developed market regions. During the majority of this cycle, US and European companies have, in aggregate, preferred to issue low cost debt to fund dividend payments and stock buybacks whereas Japanese firms have continued to pay down debt. As we previously mentioned, we have reason to believe that will change.
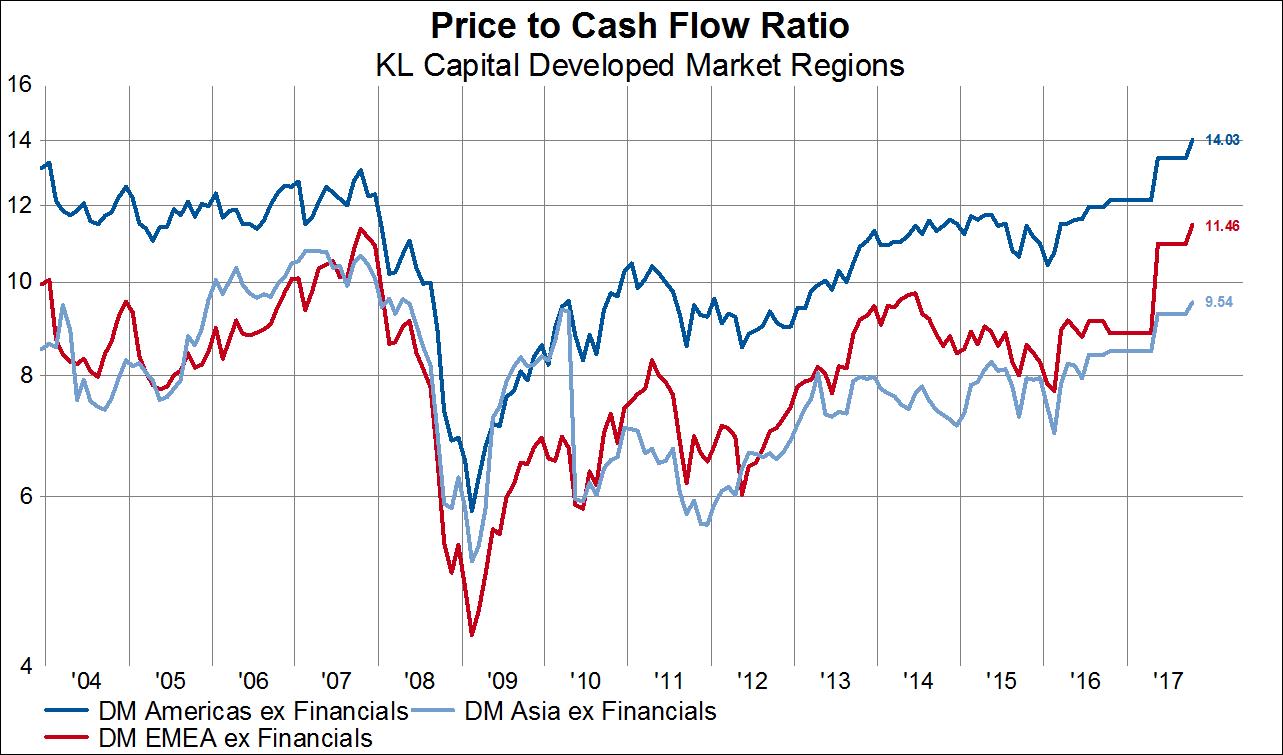
We’ll end with a brief discussion of valuations. Valuations can be sliced and diced any number of ways, but today we’ll focus on the price to cash flow multiple. The aggregate P/CF multiple for US and European companies is at a cycle high that eclipsed the highs seen in 2007. The Japanese aggregate P/CF is at a cycle high, but is still at a level below that which prevailed from 2006-2007. This could be viewed positively given the improved aggregate fundamentals since the last cycle and the growing possibility of larger portion of retained earnings being returned to shareholders.