by John Lynch, Chief Investment Strategist, LPL Financial
KEY TAKEAWAYS
- Excluding the hurricane-riddled insurance sector, Corporate America produced its third straight quarter of double-digit earnings growth.
- Strong revenue upside, outstanding technology sector performance, and rising estimates were among the highlights.
- Positive earnings growth continues to provide support for the stock market, even at elevated valuations
Corporate America delivered another outstanding earnings season. S&P 500 Index earnings are tracking to an 8.2% year-over-year increase for the third quarter with just a handful of companies left to report. Excluding the impact of hurricanes within the insurance group, corporate America produced its third straight quarter of double-digit earnings growth. The amount of upside to earnings estimates was slightly below average in the quarter, but we consider the season a success given the strong upside to revenue forecasts, along with generally upbeat outlooks from corporate management teams.
The consistency with which companies have beaten estimates is particularly impressive, even when considering the historical pattern of consensus estimate reductions that give companies a lower bar. Earnings have beaten consensus estimates for 34 consecutive quarters, covering much of the current economic expansion (based on Thomson data).
SEASON HIGHLIGHTS
Here we share three highlights from the third quarter earnings season.
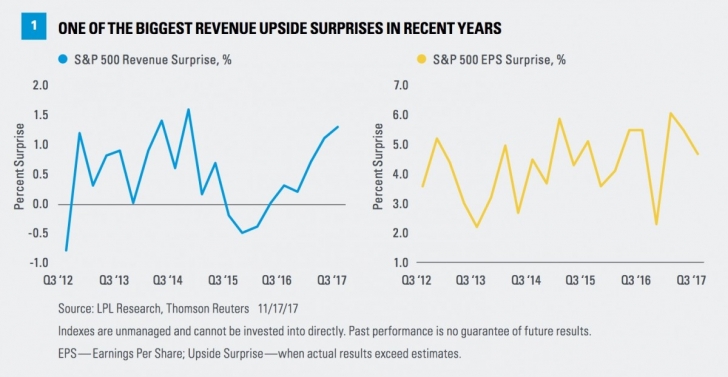
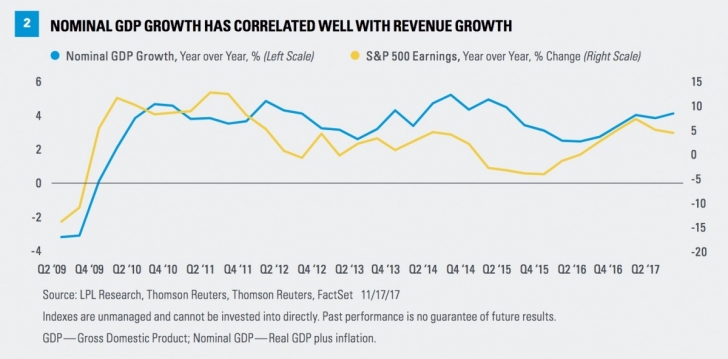
Revenue upside. S&P 500 revenue rose a solid 5.4% year-over-year in the third quarter. Perhaps more impressively, the index produced a revenue upside surprise of 1.3% compared with estimates as of September 30, 2017, one of the best performances of recent years [Figure 1]. The revenue beat rate of 67% has only been topped once since 2011 and that was last quarter (Q2 2017) at 69%. The correlation between revenue and nominal gross domestic product (GDP) — or GDP including inflation — clearly helped during the quarter as the pace of nominal economic growth has picked up from under 3% in 2016 to about 4% over the past three quarters [Figure 2]. (Note that GDP is commonly reported in real, or inflation-adjusted terms.)
The earnings upside for the S&P 500 has been fairly typical this earnings season. The average company has produced upside of 4.7% while on a market cap weighted basis the upside is a more moderate 2.3%.
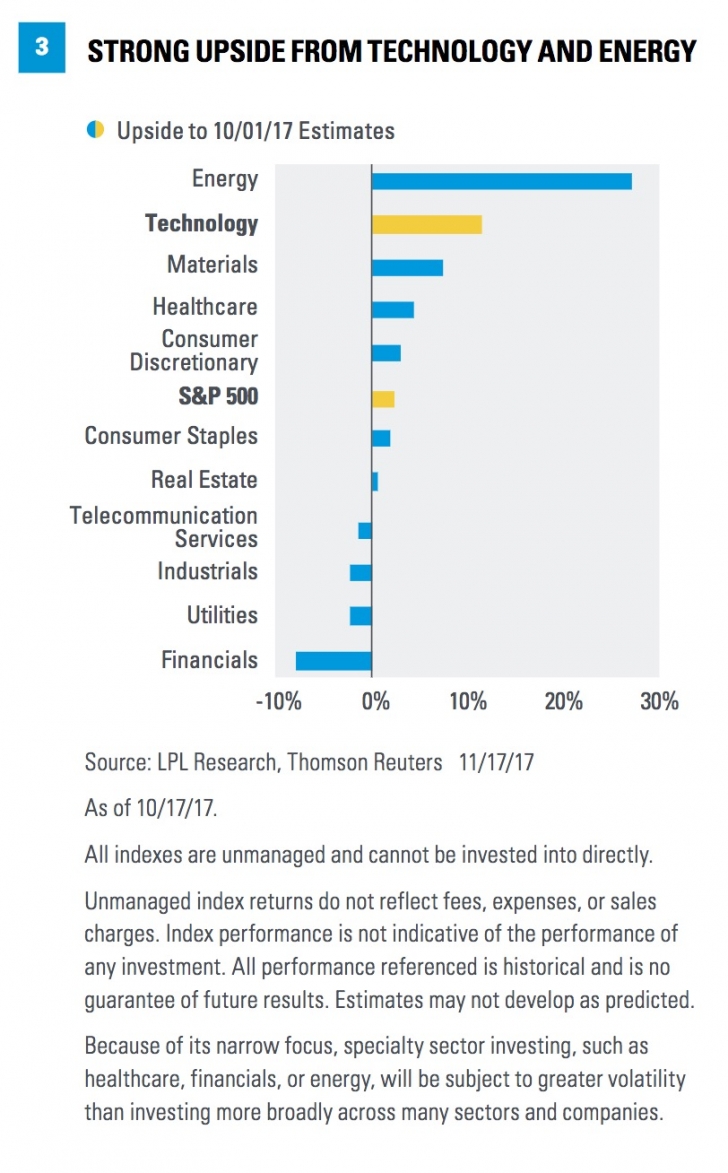
Technology strength. Although the energy sector produced the most upside to estimates among the 11 sectors, energy’s gains came off of a very low base with easy comparisons. As a result, we are more impressed with the upside that the technology sector produced — more than 11% above estimates [Figure 3]. At 24%, the earnings growth rate the sector produced in the quarter isn’t too shabby. Semiconductor strength was the biggest driver, while internet and cloud computing themes were evident.
The quarter has not been only about technology, though the sector has contributed roughly two-thirds of the overall S&P 500 increase; energy has contributed about 30% of the increase while healthcare has contributed about 15%.
Rising estimates. It is rare to see S&P 500 estimates for the next four quarters rise during earnings season but that is indeed what has happened. Since October 1, estimates for the next four quarters — the fourth quarter of 2017 through the third quarter of 2018 — have risen by 0.3%. That doesn’t sound like much but compared to the average 2–3% decline, and last quarter’s 0.6% drop, it is very impressive and suggests optimism among corporate management teams.
We believe this dynamic reflects a favorable macroeconomic environment for corporate America, more so than analysts lifting their estimates to factor in the impact of tax reform. Better growth, improving capital equipment spending, strong consumer and business confidence, a weaker U.S. dollar, and limited wage pressures are among the factors supporting management outlooks for corporate profits. Meanwhile, market-based measures of tax policy optimism suggest still low expectations for a corporate tax cut, even after the House passed its tax package on November 16. Next month we will update our Corporate Beige Book barometer: an analysis of the topics covered in companies’ earnings conference calls.
CONCLUSION
Third quarter earnings season has come to a close and it was another good one. Despite significant hurricane drags, companies produced solid earnings and revenue, led by the technology sector’s stellar performance, while forward estimates uncharacteristically rose. The macroeconomic environment is supportive of further earnings gains, even in the absence of tax reform. Strong earnings continue to support stocks even at elevated valuations. Much more on earnings coming in our Outlook 2018 publication due out next week where we discuss the potential for a tax boost to 2018 S&P 500 earnings and whether next year’s consensus estimates around $146 per share are in play (hint: we think that they are if the corporate rate is lowered).
We hope the Thanksgiving holiday is enjoyable for all.
*****
IMPORTANT DISCLOSURES
The opinions voiced in this material are for general information only and are not intended to provide specific advice or recommendations for any individual. To determine which investment(s) may be appropriate for you, consult your financial advisor prior to investing. All performance referenced is historical and is no guarantee of future results.
The economic forecasts set forth in the presentation may not develop as predicted and there can be no guarantee that strategies promoted will be successful.
Investing in stock includes numerous specific risks including: the fluctuation of dividend, loss of principal, and potential liquidity of the investment in a falling market.
Gross Domestic Product (GDP) is the monetary value of all the finished goods and services produced within a country's borders in a specific time period, though GDP is usually calculated on an annual basis. It includes all of private and public consumption, government outlays, investments and exports less imports that occur within a defined territory.
Because of its narrow focus, specialty sector investing, such as healthcare, financials, or energy, will be subject to greater volatility than investing more broadly across many sectors and companies.
The fast price swings in commodities and currencies will result in significant volatility in an investor’s holdings.
All investing involves risk including loss of principal.
INDEX DESCRIPTIONS
The Standard & Poor’s 500 Index is a capitalization-weighted index of 500 stocks designed to measure performance of the broad domestic economy through changes in the aggregate market value of 500 stocks representing all major industries.
Copyright © LPL Financial


