by Jeffrey Saut, Chief Investment Strategist, Raymond James
We have always liked the clip from the movie Animal House where in the “Deltas on Trial” scene the smooth talking Eric “Otter” Stratton get up and says, “Point of parliamentary procedure.” From there Otter goes on a diatribe ending with the comment, “Isn’t this an indictment of our entire American society? Well, you can do what you want to us, but we are not going to sit here and listen to you bad-mouth the United States of America; gentlemen . . .” and with that the entire Delta fraternity gets up and walks out of the trial (see the clip here: Otter).
Wikipedia defines a point of parliamentary procedure as, “In parliamentary procedure, a point is when someone draws attention to a rules violation in a meeting of a deliberative assembly.” We got called on a rules violation last week in one of our meetings. Well, maybe it wasn’t really a “rules violation” per se, but rather a call for clarification. Indeed, a week ago we wrote:
I went back and studied my notes dating back to the 1960s and after ALL the rallies like we have seen since the November presidential election (the runaway rally that we called), most of the gains have been given back in a “selling stampede.” Not that we are predicting an end to the secular bull market, for we are not, but there is NO exception to the subsequent outcome. The only time stocks have not suffered such an outcome has been at the start of a huge up move. Obviously, we are not at the start of a huge up move. That said, pullbacks are for buying because we believe this secular bull market has at least another 10+ years left in it!
What we should have stated is that it is the final stage of a melt-up move that typically gets “given back.” In the current case that would be the August to last week “melt up.” If that happens it would mean the S&P 500 (SPX/2582.30) could fall back to 2425, which is where the final “melt up” stage began. That would be a full giveback, yet the SPX does have some support at the upside chart gap between 2560 – 2565 and then at 2525. If we do finally get a pullback, watch those key levels in order to determine if we are going to get a full downside correction. Also worth noting is that our short-term proprietary model was as “stretched to the upside” as it has ever been at the beginning of last week.
Speaking to last week’s action, it was the first down week in eight weeks and that weakness caused the SPX to break below its rising trendline, an ascending trendline that has contained declines since those August lows (Chart 1). Looking at some of our other indicators reveals our momentum indicator remains on a “marginal buy.” Our Advance/Decline Indicator (breadth) is at a neutral reading and our Investor Sentiment indicator is at its most extremely bullish reading in years (read: bearish). As our friend Jason Goepfert, of the must have SentimenTrader publication, writes:
Heading into [President Trump’s] year 2, stocks saw one of the best 1st-year gains after a presidential election since 1950. Year 2 [historically] was a tougher slog, with a barely positive risk/reward ratio during the year. Year 3 was just about perfect.
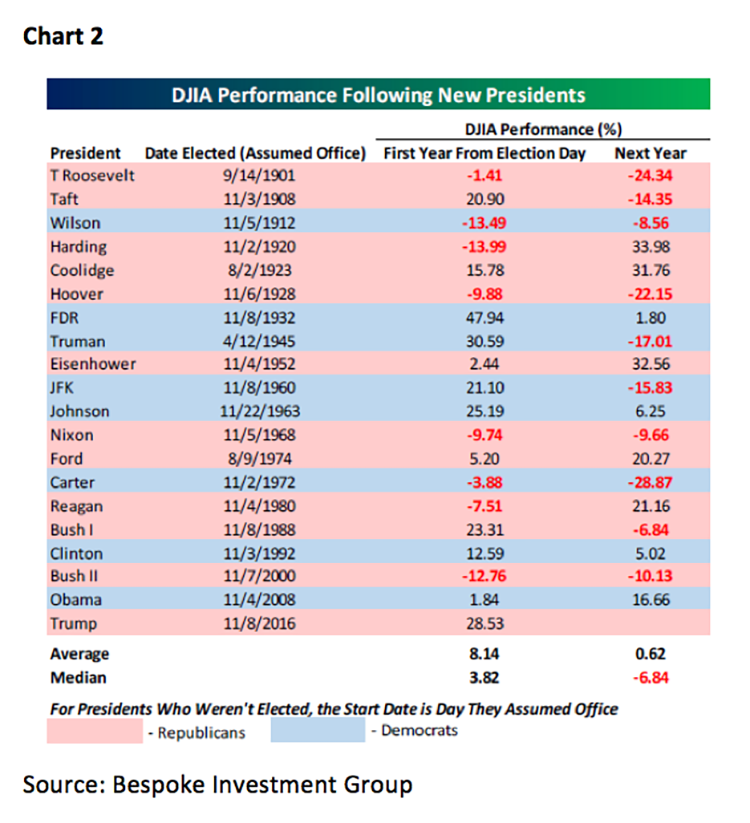
Moreover, our friends at the astute Bespoke Investment Group also note:
The scatter chart shows the performances of the DJIA for each President listed on their first and second year from Election Day or assuming office. What’s important to note about this chart is that while market performance following first year gains of less than 20% were pretty much evenly split between gains and losses, after years where the DJIA rallied more than 20%, performance was negative in the second year two-thirds of the time (Chart 2).
So what do you do as a long-term investor right here? Most important to remember, being a long-term investor does not mean you never sell stocks. Rebalancing, and reallocating, your portfolio is one of the major keys to investment success. Investors need to adjust their stock positions based on what is occurring in the economy, business cycle, sectors, etc. For example, one of the sectors we have avoided, or underweighted, for over a year is the consumer Staples sector on the belief that it is pretty expensive. As Jefferies analyst Kevin Grundy writes in today’s Barron’s:
Estimates [of] the large group of staple stocks [I] track has an average P/E of 19.9 times, based on expected results for the next 12 months, an 11% premium to the S&P 500. . . . [T]hat makes it the fourth most expensive sector. [I] expect valuations to have a hard time expanding from here, given that companies have seen persistently soft organic sales and rising input costs, and consensus earnings estimates are coming down.
Reading on in Barron’s we found an article on Sony titled “Sony Recaptures Its Youthful Bounce.” Said article reminded us of a story as related to us by our friend Arthur Cashin. To wit:
“A time long ago in a galaxy far away” there actually were specialists that made markets for stocks on the floor of the NYSE. One of the best specialists was Albert Fried who knew the stocks he made markets in better than anyone else on the planet. One of the stocks he knew best was Sony. One day the CEO of a major brokerage firm instructed his floor broker to ask Al how much Sony stock was for sale at $12.50 when it was then trading at $13.50. Al replied that Sony would never trade at $12.50 in his lifetime. The floor broker dutifully reported that back to his CEO. Subsequently, the CEO told his floor broker to go back to Albert Fried and tell him he has 30 seconds to live and to put up for sale 24 million shares of Sony at the market!
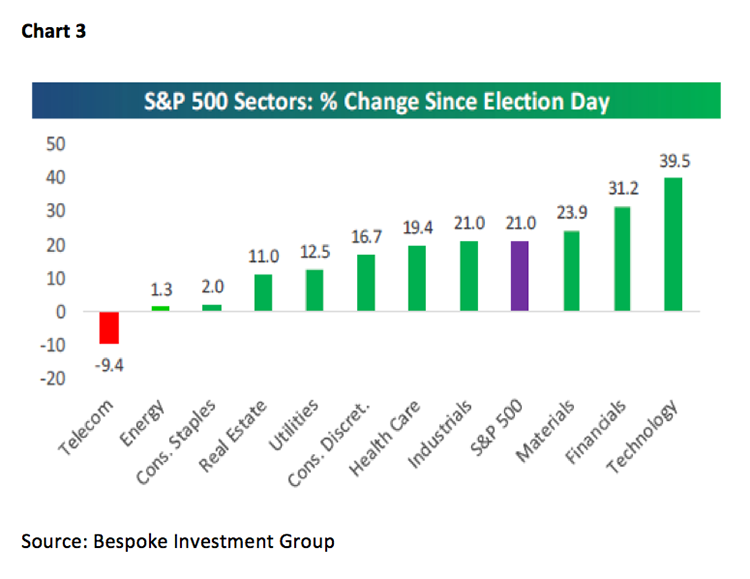
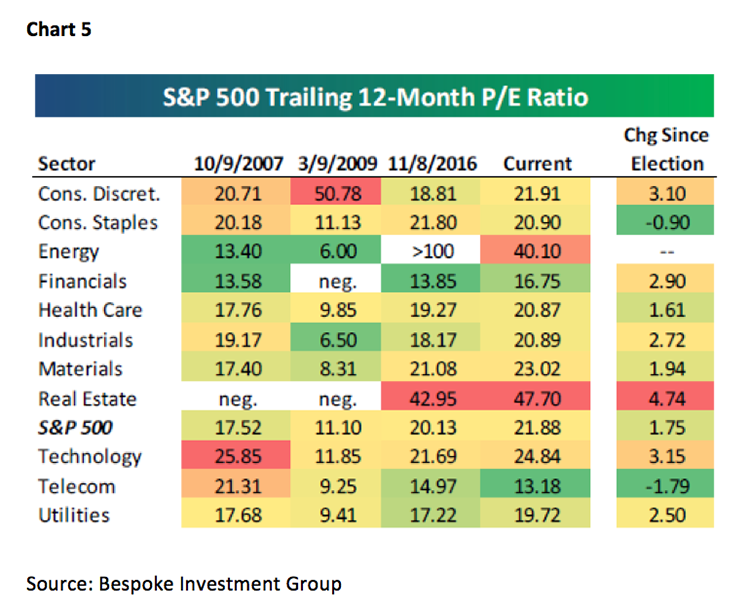
Moving on to the sectors, since the presidential election it is interesting to see which sectors have performed the best. As readers of these missives know we have favored technology, financials, materials, industrials, consumer discretionary, and energy. Technology, financials, and materials have outperformed the S&P 500 while the others have not (Chart 3). Also of interest is how the sector weightings have shifted since the election (Chart 4). Then too, investors should consider the valuations of the various sector, which can be seen in Chart 5. In studying these sector metrics it becomes clear why investors need to rebalance and reallocate their portfolios.
Finally, and again from this week’s Barron’s, is the answer to the question Andrew and I have been pounded with over the past three weeks – what is the “crash” in the high yield bond market telling us? – to which we reply, “absolutely nothing!” From Barron’s (as paraphrased) – many of the high yield bond proxies have declined for three straight weeks, the longest losing streak in nearly a year. The weakness has some investors wondering what junk bonds are seeing that we’re missing.
The answer, according to Evercore ISI’s DeBussehere is, “Many of the moves in the high-yield bonds last week were as much a matter of catching up to these stock market moves as something lurking beneath the surface.”
The call for this week: Again as written in Barron’s, “A Wellington Shields report notes that the records come with a surprisingly few stocks advancing. Last Tuesday’s new high in the Dow came with fewer than half the components participating. The NASDAQ likewise hit an all-time record with fewer than 30% of [its] stocks rising.” Ladies and gentlemen, there is a reason for that. For the last three years 28% of the S&P 500’s 27.2% return has come from the FAANG stocks (Chart 6). If you did not own the FAANGs you have been underperforming. It’s option expiration week so traders will try for new highs. If they fail to achieve that, traders/investors should be alert for signs that a trading top has occurred, or is forming. As we write at 5:30 a.m. the preopening S&P 500 futures are down 3.25 points despite DJT’s successful Asian sojourn.


Additional information is available on request. This document may not be reprinted without permission.
Raymond James & Associates may make a market in stocks mentioned in this report and may have managed/co-managed a public/follow-on offering of these shares or otherwise provided investment banking services to companies mentioned in this report in the past three years.
RJ&A or its officers, employees, or affiliates may 1) currently own shares, options, rights or warrants and/or 2) execute transactions in the securities mentioned in this report that may or may not be consistent with this report’s conclusions.
The opinions offered by Mr. Saut should be considered a part of your overall decision-making process. For more information about this report – to discuss how this outlook may affect your personal situation and/or to learn how this insight may be incorporated into your investment strategy – please contact your Raymond James Financial Advisor.
All expressions of opinion reflect the judgment of the Equity Research Department of Raymond James & Associates at this time and are subject to change. Information has been obtained from sources considered reliable, but we do not guarantee that the material presented is accurate or that it provides a complete description of the securities, markets or developments mentioned. Other Raymond James departments may have information that is not available to the Equity Research Department about companies mentioned. We may, from time to time, have a position in the securities mentioned and may execute transactions that may not be consistent with this presentation’s conclusions. We may perform investment banking or other services for, or solicit investment banking business from, any company mentioned. Investments mentioned are subject to availability and market conditions. All yields represent past performance and may not be indicative of future results. Raymond James & Associates, Raymond James Financial Services and Raymond James Ltd. are wholly-owned subsidiaries of Raymond James Financial.
International securities involve additional risks such as currency fluctuations, differing financial accounting standards, and possible political and economic instability. These risks are greater in emerging markets.
Investors should consider the investment objectives, risks, and charges and expenses of mutual funds carefully before investing. The prospectus contains this and other information about mutual funds. The prospectus is available from your financial advisor and should be read carefully before investing.
Copyright © Raymond James
_d2 (002).png)