
Active vs Passive: When, Where and Why to be Which
by Craig Basinger, Chris Kerlow, Derek Benedet, Shane Obata, Connected Wealth, RichardsonGMP
In 1950, 90% of U.S. stocks were owned directly by households, with the rest owned by international investors and funds. During the 1970s and 80s, pension and government retirement assets ballooned, reducing households to about 55%. In the 1990s, it was the rise of mutual funds, which drove household direct stock ownership down to 45%.
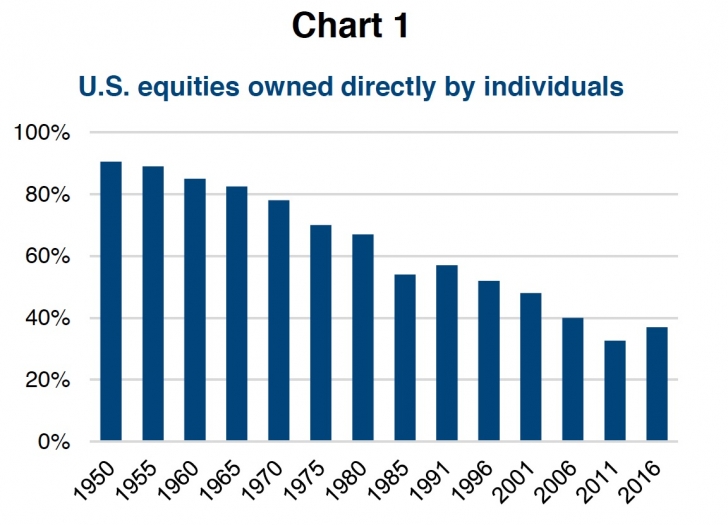
In the past decade, ETFs have been the big growth driver, with households now down below 40% (chart 1). Today, the rest of equities are split between mutual funds (24%), ETFs (6%), pension and government funds (13%), international investors (15%), hedge funds (3%) and other (3%) according to the Federal Reserve. The only real constant when it comes to the markets is change, which certainly has accelerated in the past decade.
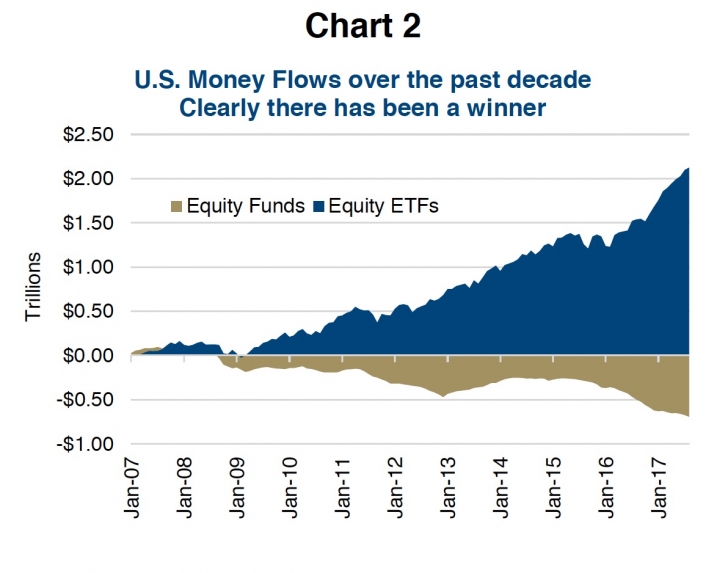
While ETFs appear small at 6% of assets, this underrepresents just how much has changed in the past decade. U.S. equities have a total value of about $42 trillion, so even a 1% change in market share ownership is a big move. Over the past decade over $2 trillion has flowed into ETFs while mutual funds have seen $1/2 trillion in outflows (chart 2). We are clearly in the age of ETFs.
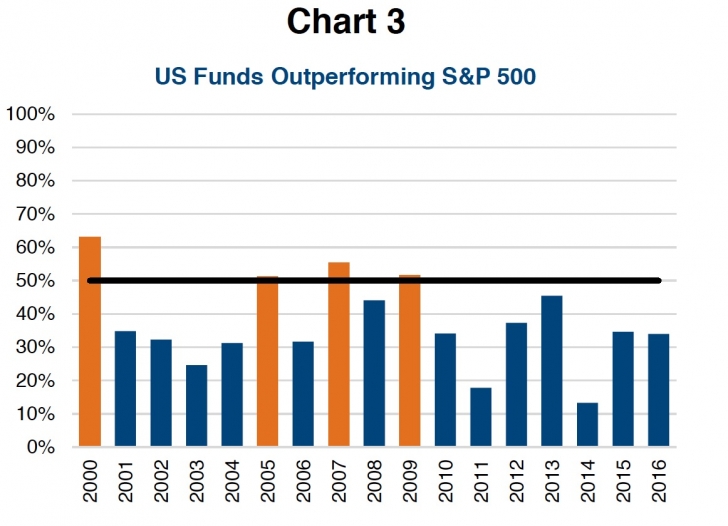
There have really been a couple key drivers of this trend among investors from mutual funds into ETFs – performance and fees. According to the SPIVA reports, which track the percentage of funds that beat the index, mutual funds have had a really tough time. During the past 17 years, mutual funds on average have outperformed the index in only four of the years based on U.S. data. Worse yet for active mutual funds, the last 7 years the index has really dominated performance.
This included 2011 when less than 20% of funds outperformed and in 2013 only 12% outperformed (chart 3). This trend has been evident in Canada as well. During the past 1, 3 and 5-year periods Canadian funds that outperformed the TSX Composite were 33%, 18% and 25% respectively. That means over the past 5 years you had a 1 in 4 chance of investing in a fund that beat the index. This extremely one-sided performance favouring the index has certainly encouraged many investors to give up on active mutual funds and pile into ETFs.
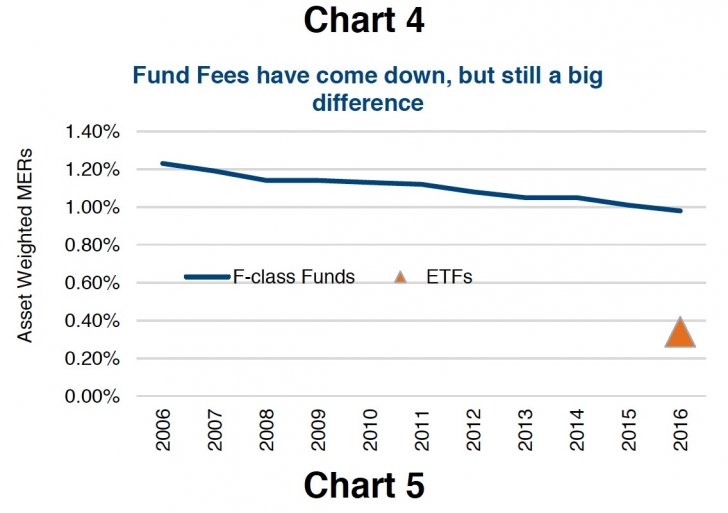
Then there is the fee argument. Fees have been coming down among mutual funds over the past decade. F-class funds, that don’t include any trailer paid for advice, had average Management Expense Ratios (MER) of 1.21% in 2006, dropping to 0.98% by 2016.That is impressive and a good trend for investors. However, Canadian ETFs have an asset weighted MER of 0.34%, so the spread is still fairly material (chart 4). Fees are not the only input in an investment decision, but they are an important one.
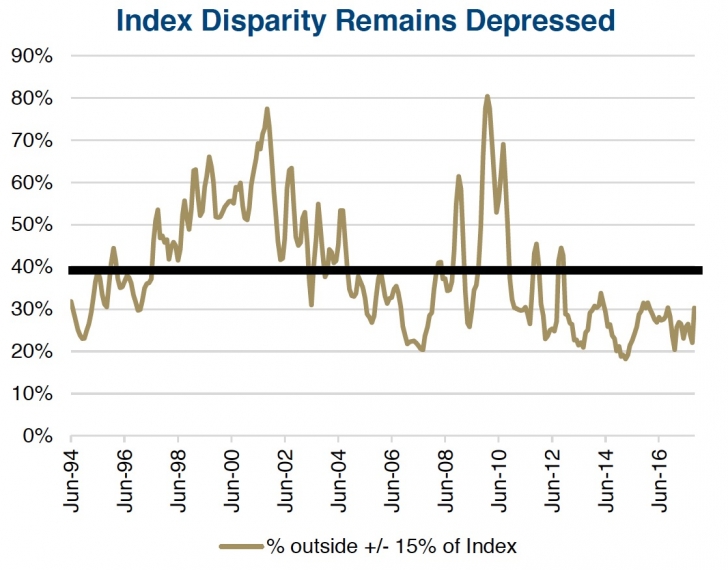
Better performance and lower fees have certainly helped increase flows going into ETFs at the expense of mutual funds. But there are other important factors investors should consider. This has been a momentum driven market, which late in the market cycle, favours market capitalization weighted indices. There has also been low stock disparity since 2010 (chart 5). Index disparity measures the variance of individual stock performance relative to the index. High disparity means individual stock performance is often materially higher or lower than the aggregate index. In this environment, an active manager that can identify and own the winners can more easily outperform the index. Assuming they can find the winners. Conversely, when disparity is low even if you can pick the winners, they may not contribute enough to performance to overcome fees and outperform the index. As you can see in Chart 5, we have been in an extended period of low disparity. Not the best environment for active money management which remains primarily in the mutual fund world.
Over time we have found a correlation between disparity and the percentage of funds that outperform an index. Lower disparity often means fewer funds beat the index.
So Are Passive ETFs Simply Better, Not So Fast
While hard to argue with the numbers, it is not so simple. Firstly, there may be a cyclical nature to disparity during the market cycle. This would favour indexing (passive ETFs) late in the market cycle when disparity is low. This is the current environment. However, during bear markets and the early years of a bull market, disparity tends to be higher. This may argue for tilting more passively in late bulls but more active when the bear arrives.
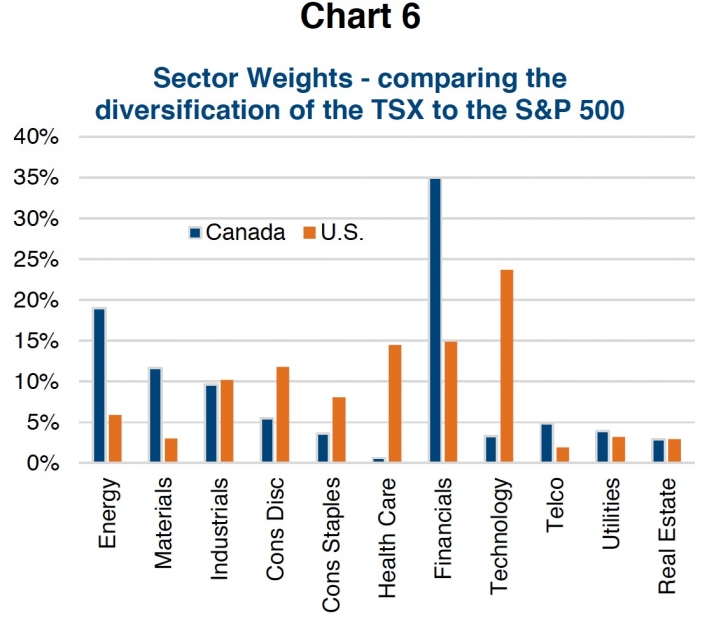
Secondly, there is also market efficiency. An index is constructed by a committee that meets infrequently with companies being added or removed based on the market caps of the companies trading in that country. That is a crazy way to build a portfolio. As a result, some indices are better diversified and some are not. The S&P 500 is better diversified than the TSX, which has 35% in Financials, virtually no Health Care or Consumer stocks. An active manager could better control the skewed risk that is in the passive index (chart 6). Then there are markets that are less liquid or don’t trade very efficiently. Again this favours more opportunistic active managers. Examples include the preferred share market in Canada or the high yield bond market.
Investment Implications
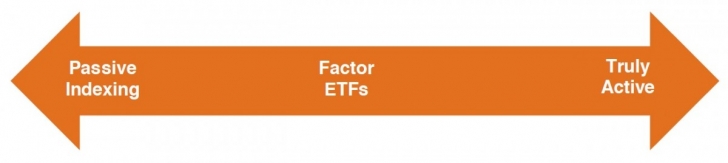
We believe investors should think of the active vs. passive debate as a spectrum for a few reasons. First, it is no longer an ETF vs Mutual Fund question as more and more ETFs are either factor based or actively managed. In more efficient markets, investors could lean more towards passive indexing strategies to lower portfolio management costs. In less efficient markets, lean more on active managers who can take advantage of market inefficiencies or better control risk. Plus, given how far along we are in this market cycle, this may be the time to start reducing passive and tilting a little more active.
Factor based ETFs can offer a happy medium. Costs tend to be lower than most active managers and they can gain exposure to desired factors such as dividends, quality or momentum. However, it is important to dive into the underlying holdings to understand any added risk of the factor. It often leads to more concentration in certain sectors and less exposure in others. That is fine as long as you are comfortable with the exposures. Knowing your product is key.
Finally for active managers, they need to be truly actives. Very different than the broad indices and even different than the factor ETFs. One of the great benefits of the rise of ETFs is that it is driving closet index funds, those that just are not that different than the benchmark, out of business.
Charts are sourced to Bloomberg unless otherwise noted. This material is provided for general information and is not to be construed as an offer or solicitation for the sale or purchase of securities mentioned herein. Past performance may not be repeated. Every effort has been made to compile this material from reliable sources however no warranty can be made as to its accuracy or completeness. Before acting on any of the above, please seek individual financial advice based on your personal circumstances. However, neither the author nor Richardson GMP Limited makes any representation or warranty, expressed or implied, in respect thereof, or takes any responsibility for any errors or omissions which may be contained herein or accepts any liability whatsoever for any loss arising from any use or reliance on this report or its contents. Richardson GMP Limited is a member of Canadian Investor Protection Fund. Richardson is a trade-mark of James Richardson & Sons, Limited. GMP is a registered trade-mark of GMP Securities L.P. Both used under license by Richardson GMP Limited.