For this week’s edition of the Equity Leaders Weekly, we are going to take a look at the Candian Equity Asset Class through the S&P/TSX Composite Index as it has marched onto all-time high territory. We will also look at the High-Grade Copper Continuous Contract as this is an important commodity for the TSX Composite Index given its significantly large exposure to mining names.
S&P/TSX Composite Index (TSX.I)
“Markets Continue Higher” – This was a headline we featured in our Equity Leaders Weekly edition on October 19th when we commented on the International and U.S. Equity Asset Classes. Today, let’s analyze how the S&P/TSX Composite Index (TSX.I) has fared since our last commentary on Sept 28th. “A Rising Tide Lifts All Boats” has sure come into play in the equity markets around the world. While looking at Canada, we also have sees that it has now joined the U.S. (S&P 500, Dow, and Nasdaq Indexes) and many World Indexes, especially in Europe where Germany, Norway, and Sweden moved into all-time high territory and also in Asia where India and South Korea have hit historic highs. The TSX.I had earlier this week broken above the 16,000 level for the first time.
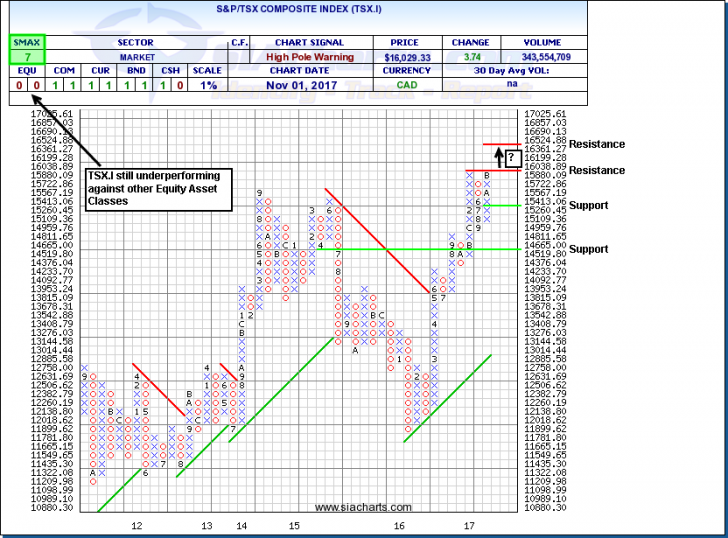
Let’s look at the attached chart of the TSX.I to see what might ahead for this important index. Looking at the 1% Point and Figure (PnF) chart on the TSX.I, as it gives us more information about its recent movement than the 2% chart,you can see the TSX.I is now in all-time high territory as it has broken above the previous high of 15,880 back earlier this year. It is quickly approaching a critical resistance point at 16,038.89. It if manages to break above this level, the next level of resistance could be found around 16,524.88. Support can now be found at 15,260.45 and below this at 14,519.80 should this recent strength reverse. With an SMAX of 7 out 10, it is only showing near-term strength against most asset classes. Of note, it is not showing any near or long-term strength against the other equity asset classes which outlines the fact that the TSX is still underperforming the other equity asset classes, US and Int’l Equity, at this time.

High Grade Copper Continuous Contract (HG.F)
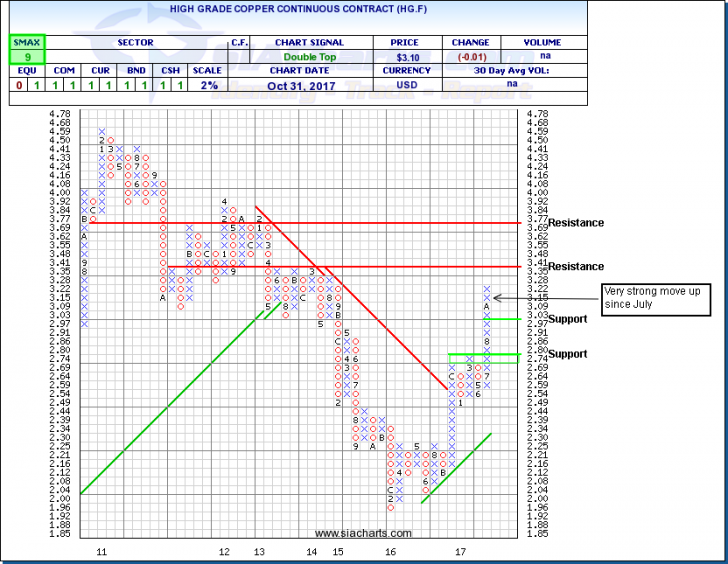
The last time we looked at the High-Grade Copper Continuous Contract (HG. F) was back on August 10 where Copper was beginning to break out in a Double Top pattern with a SMAX score of 10 out of 10 and has continued this strength recently moving over $3 for the first time in 2 years. Copper is often viewed as an indicator of economic health by economists. Due to its stigma of being a leading economic proxy it is often referred to as Dr. Copper by many market pundits. With all three equity classes now in all-time high territory, lets analyze the price movement of Copper to see if we can gauge what may lie ahead for the commodity and indirectly some of economic health around the world. In looking at the attached chart, we see that Copper has experienced a very strong move with a rising column of X’s since July of this year. The next area of resistance can now be found at $3.41. If it manages to break above this level, the next area of resistance is at $3.77. To the downside, support can be found at $2.97 and, below that, the $2.69 to $2.77 range. With an SMAX of 9 out of 10, Copper is showing near-term strength against most asset classes.
As we know, the TSX Composite Index has a significant weighing towards resource sector names. Needless to say, the price action of the underlying commodities such as Copper could have an impact on which direction the index will resolve to, but so far in 2017, the Financial/Banking sector has been one of the main drivers for the index with Metals & Mining and Energy lagging so far. And as with any Relative Strength comparison, it is important to keep in mind the other Equity opportunities outside of Canada in the U.S. and Internationally that continue to be Favored that may be able to provide better risk/reward benefits going forward.

SIACharts.com specifically represents that it does not give investment advice or advocate the purchase or sale of any security or investment. None of the information contained in this website or document constitutes an offer to sell or the solicitation of an offer to buy any security or other investment or an offer to provide investment services of any kind. Neither SIACharts.com (FundCharts Inc.) nor its third party content providers shall be liable for any errors, inaccuracies or delays in content, or for any actions taken in reliance thereon.
For a more in-depth analysis on the relative strength of the equity markets, fixed income, commodities, currencies, etc. or for more information on SIACharts.com, you can contact our sales and customer support at 1-877-668-1332 or at siateam@siacharts.com.


