by Ryan Detrick, LPL Research
2017 continues to break records, as the S&P 500 Index makes new highs amid historically low volatility:
- The index has now gone 33 consecutive sessions without a 0.5% daily decline, which is the longest streak since 1995.
- The index’s average daily change on an absolute basis so far this year has been only 0.30%, the smallest since 1965.
- The index has closed lower 1% or more only four times—the fewest for a full year since 1964.
Per Ryan Detrick, Senior Market Strategist, “I feel like a broken record, but so many times when I’m talking about 2017, I usually say ‘the last time since 1964, 1965, or 1995 when making comparisons to 2017. Those three years are widely considered the least volatile years ever, and 2017 is right there with them trying to make the medal stand.”
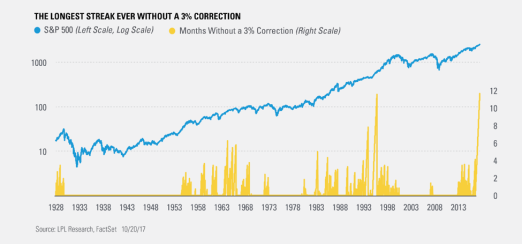
One other amazing streak may take place at Monday’s close: The S&P 500, should it return at least -2.99%, will officially have gone 242 trading days (about 11.5 months) without a 3% correction, topping the record of 241 days set in 1995. If we jinx it and the S&P 500 falls 3%, we apologize … but the last time the S&P 500 closed down more than 3% the day after making a new all-time high was in November 1991, and the index has made 474 new highs since then without a 3% drop the following day.
What can we say about 2017 that hasn’t already been said? What we’ve seen so far this year is like nothing we’ve seen for decades. Just remember that markets aren’t always this calm; and a perfectly normal correction of 3–5% could happen at any time, if for no other reason than it has been more than 11 months since the last 3% correction. Overall, the global economy continues to hum along thanks in part to strong earnings, and we aren’t seeing the excesses usually seen at previous peaks, which supports higher equity prices in 2018 and suggests that the odds of a recession are low. However, as the economic cycle continues to age, we expect volatility to get up off the mat and make a comeback.
*****
IMPORTANT DISCLOSURES
The opinions voiced in this material are for general information only and are not intended to provide or be construed as providing specific investment advice or recommendations for any individual security.
Past performance is no guarantee of future results.
The economic forecasts set forth in the presentation may not develop as predicted.
Investing in stock includes numerous specific risks including: the fluctuation of dividend, loss of principal and potential illiquidity of the investment in a falling market.
The S&P 500 Index is a capitalization-weighted index of 500 stocks designed to measure performance of the broad domestic economy through changes in the aggregate market value of 500 stocks representing all major industries.
This research material has been prepared by LPL Financial LLC.
To the extent you are receiving investment advice from a separately registered independent investment advisor, please note that LPL Financial LLC is not an affiliate of and makes no representation with respect to such entity.
Not FDIC/NCUA Insured | Not Bank/Credit Union Guaranteed | May Lose Value | Not Guaranteed by any Government Agency | Not a Bank/Credit Union Deposit
Securities and Advisory services offered through LPL Financial LLC, a Registered Investment Advisor
Member FINRA/SIPC
Tracking #1-658137 (Exp. 10/18)
Copyright © LPL Research


