by LPL Research
Friday saw the Nasdaq close at a new high, while the Dow, and S&P 500 Index made new intraday highs but sold off late to just miss new closing highs. Of course, we’ve been seeing a lot of new highs this year (not that we’re complaining) as equity markets continue to climb higher with the number of new highs posted by the three major indexes in 2017 being among the most ever.
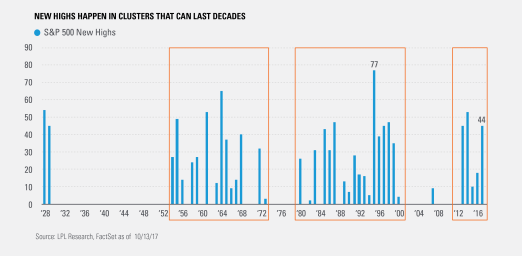
Per Ryan Detrick, Senior Market Strategist, “It is important to remember that new highs tend to happen in clusters that can last decades, but in between you can have years without new highs. Recalling this can be one clue that this bull market may not be as old as many think.”
First up, let’s take a look at the S&P 500:
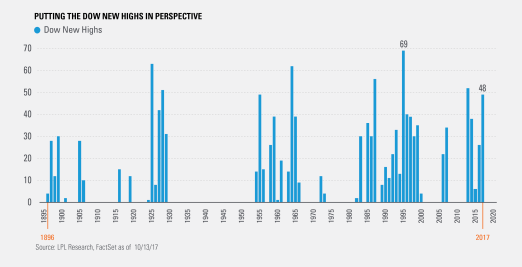
The Dow has been around since 1896, and the 48 new highs it notched this year has only been surpassed 7 times; though 22 more new highs are needed to break the all-time record set in 1995.
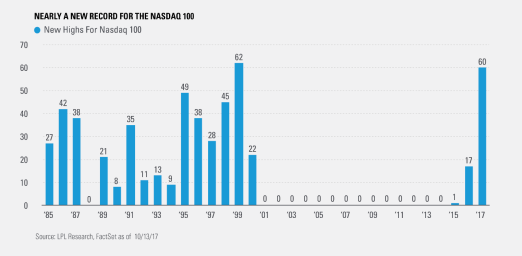
Last, the Nasdaq 100 has made 60 new highs so far this year, meaning the all-time record of 62 new highs seen in 1999 may very likely fall.
IMPORTANT DISCLOSURES
Past performance is no guarantee of future results. All indexes are unmanaged and cannot be invested into directly. The opinions voiced in this material are for general information only and are not intended to provide or be construed as providing specific investment advice or recommendations for any individual security.
The economic forecasts set forth in the presentation may not develop as predicted.
Investing in stock includes numerous specific risks including: the fluctuation of dividend, loss of principal, and potential illiquidity of the investment in a falling market.
The Dow Jones Industrial Average is the most widely used indicator of the overall condition of the stock market, a price-weighted average of 30 actively traded blue chip stocks, primarily industrials. The 30 stocks are chosen by the editors of the Wall Street Journal. The Dow is computed using a price-weighted indexing system, rather than the more common market cap-weighted indexing system.
The NASDAQ-100 is composed of the 100 largest domestic and international non-financial securities listed on The Nasdaq Stock Market. The Index reflects companies across major industry groups including computer hardware and software, telecommunications, retail/wholesale trade and biotechnology, but does not contain securities of financial companies.
The modern design of the %&P 500 stock index was first launched in 1957. Performance back to 1928 incorporates the performance of predecessor index, the S&P 90.
Stock investing involves risk including loss of principal.
The Standard & Poor’s 500 Index is a capitalization-weighted index of 500 stocks designed to measure performance of the broad domestic economy through changes in the aggregate market value of 500 stocks representing all major industries. This research material has been prepared by LPL Financial LLC.
To the extent you are receiving investment advice from a separately registered independent investment advisor, please note that LPL Financial LLC is not an affiliate of and makes no representation with respect to such entity.
Not FDIC/NCUA Insured | Not Bank/Credit Union Guaranteed | May Lose Value | Not Guaranteed by any Government Agency | Not a Bank/Credit Union Deposit
Securities and Advisory services offered through LPL Financial LLC, a Registered Investment Advisor Member FINRA/SIPC
Tracking #1-655572 (Exp. 10/18)
Copyright © LPL Research


