
by Don Vialoux, EquityClock.com
Real Time Economic Calendar provided by Investing.com.
**NEW** As part of the ongoing process to offer new and up-to-date information regarding seasonal and technical investing, we are adding a section to the daily reports that details the stocks that are entering their period of seasonal strength, based on average historical start dates. Stocks highlighted are for information purposes only and should not be considered as advice to purchase or to sell mentioned securities. As always, the use of technical and fundamental analysis is encouraged in order to fine tune entry and exit points to average seasonal trends.
Stocks Entering Period of Seasonal Strength Today:
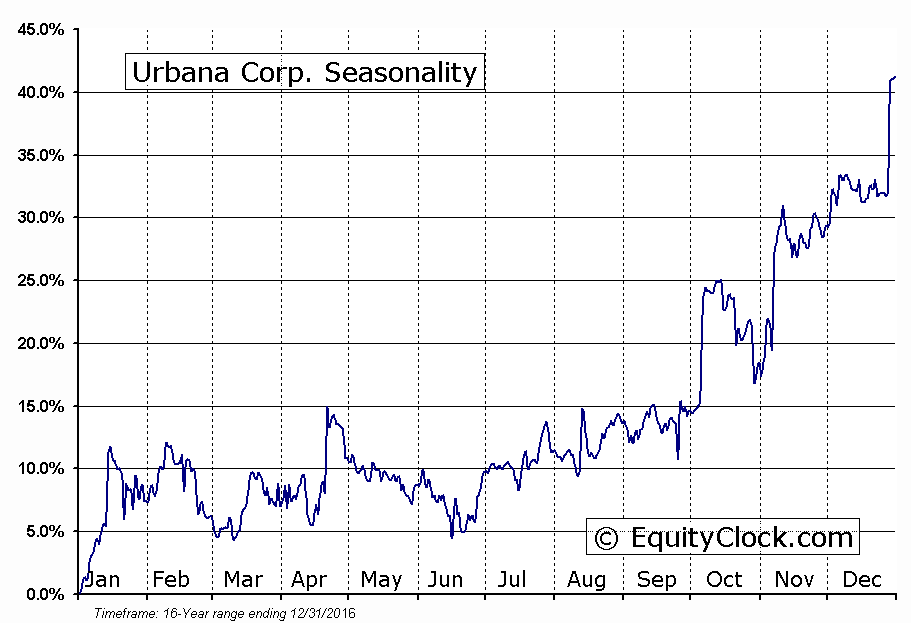
Urbana Corp. (TSE:URB) Seasonal Chart
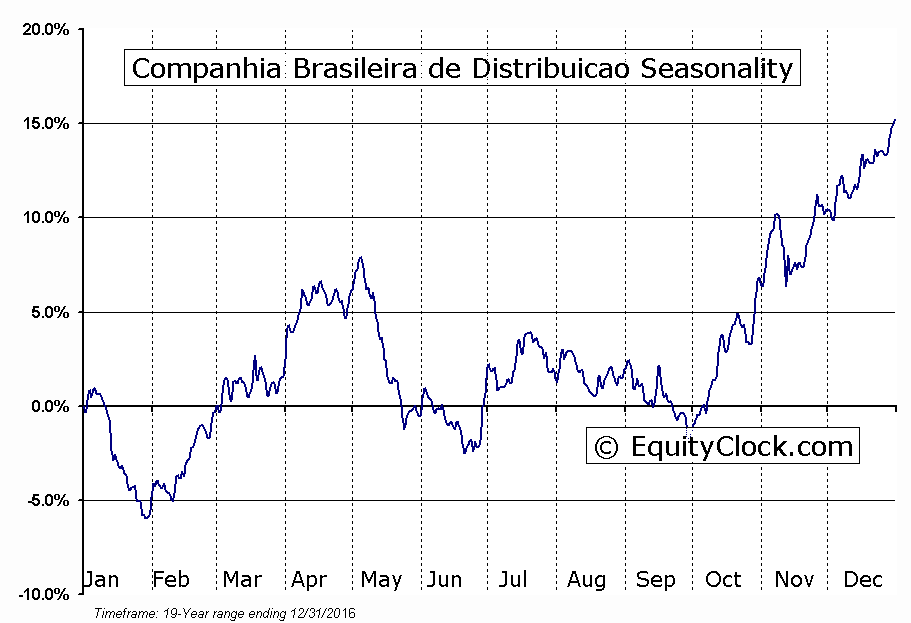
Companhia Brasileira de Distribuicao (NYSE:CBD) Seasonal Chart
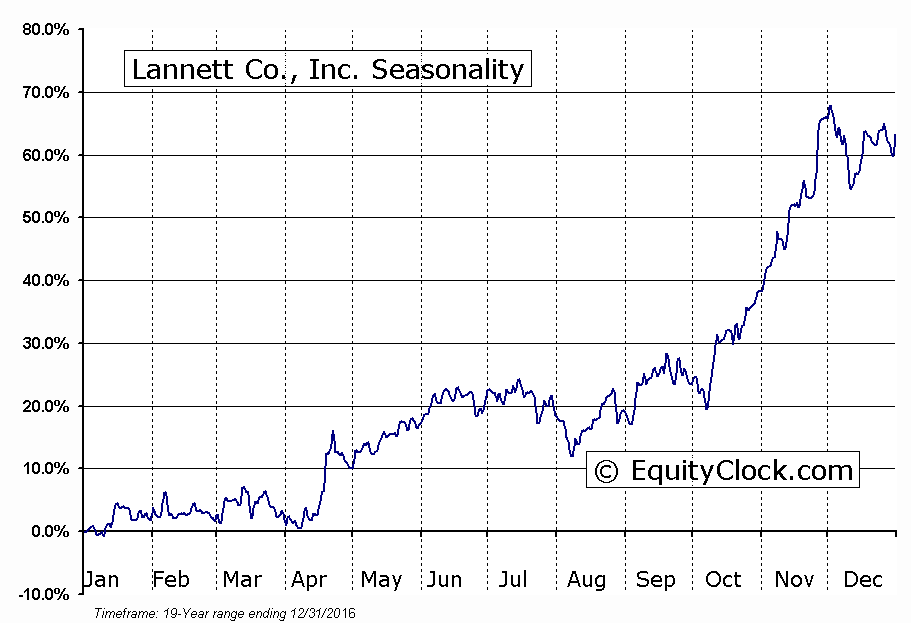
Lannett Co., Inc. (NYSE:LCI) Seasonal Chart
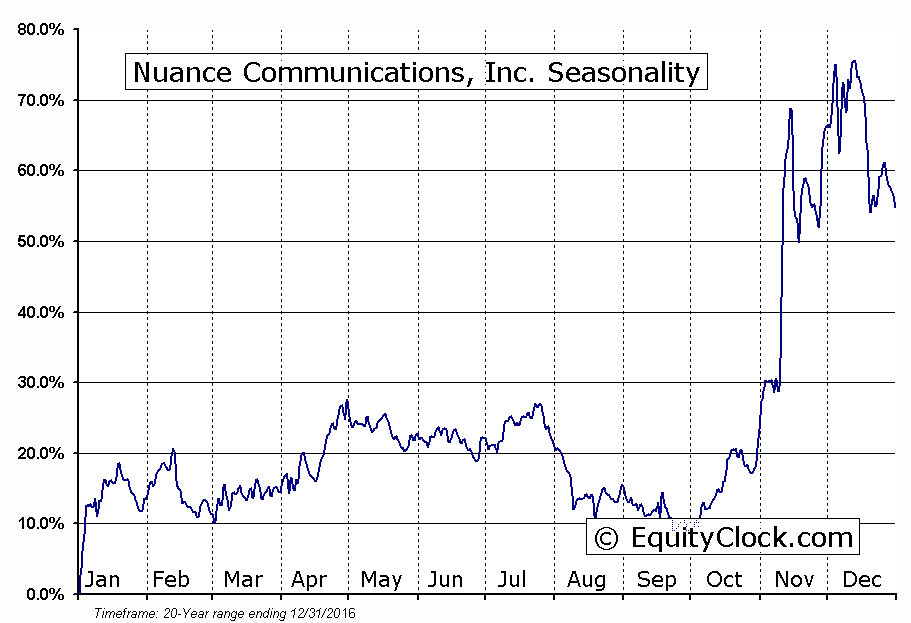
Nuance Communications, Inc. (NASD:NUAN) Seasonal Chart
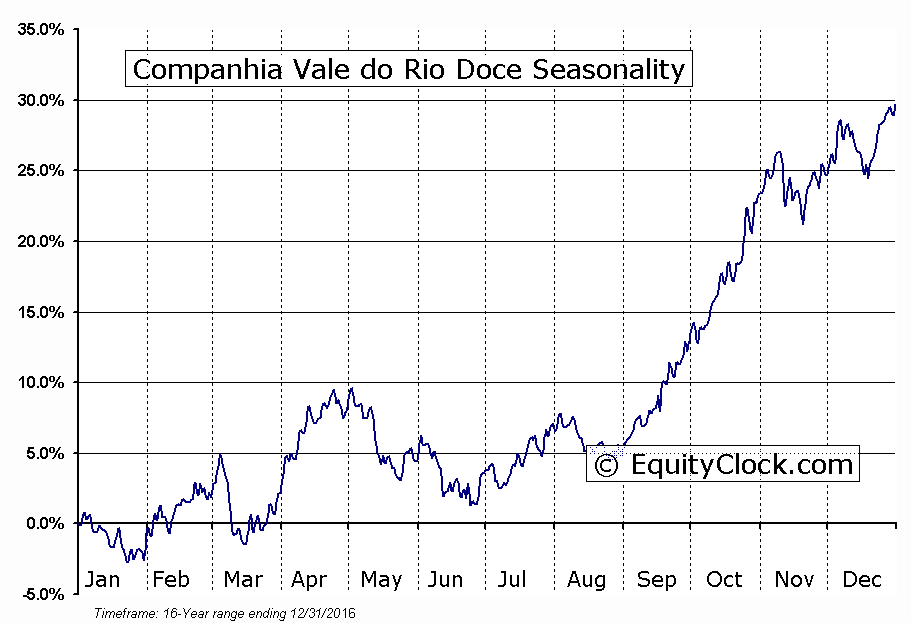
Companhia Vale do Rio Doce (NYSE:VALE-P) Seasonal Chart
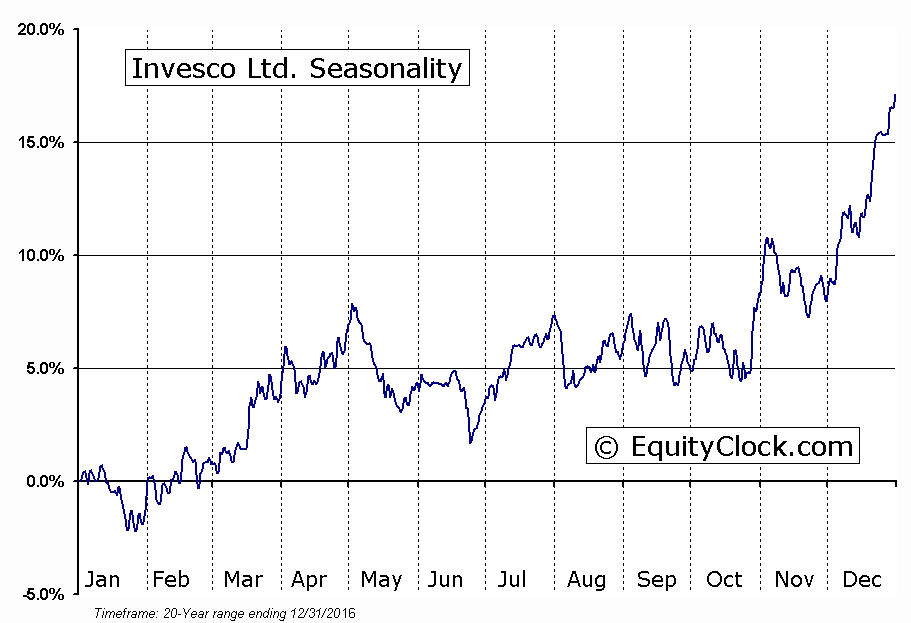
Invesco Ltd. (NYSE:IVZ) Seasonal Chart
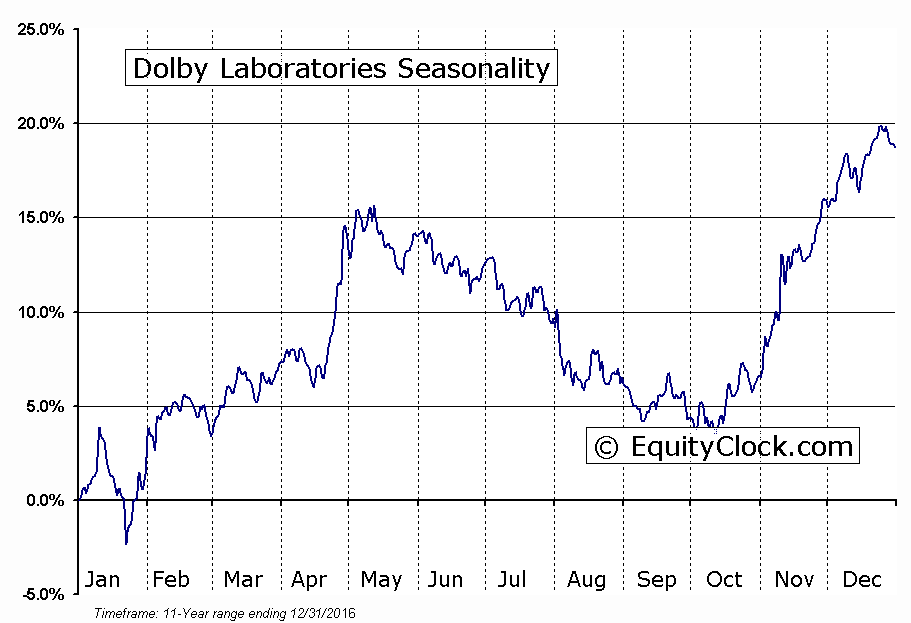
Dolby Laboratories (NYSE:DLB) Seasonal Chart
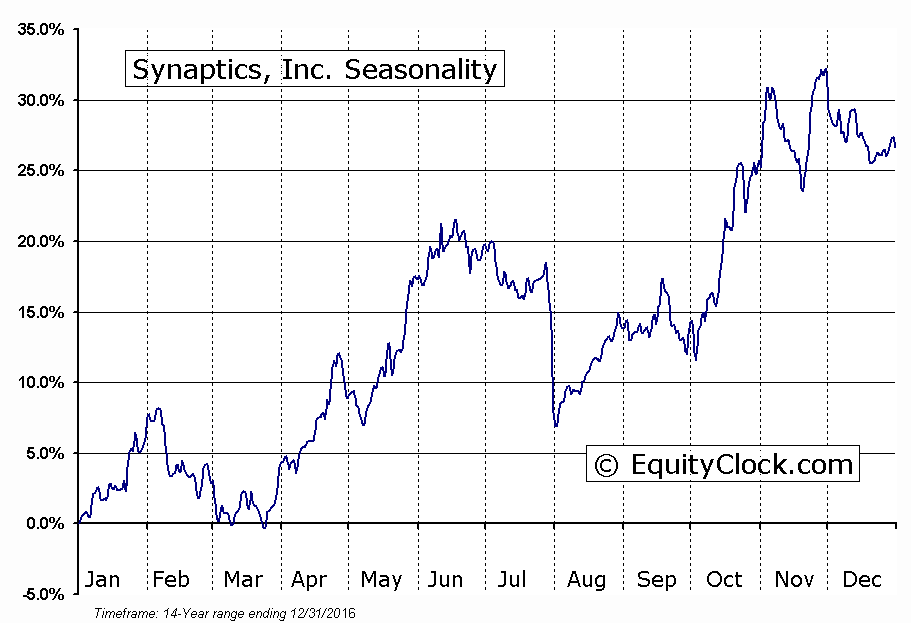
Synaptics, Inc. (NASD:SYNA) Seasonal Chart
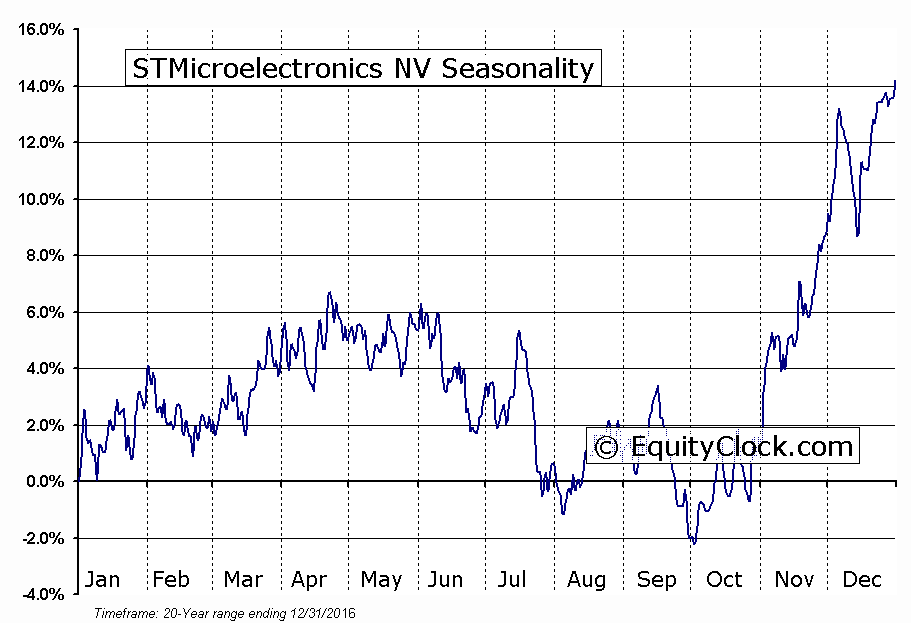
STMicroelectronics NV (NYSE:STM) Seasonal Chart
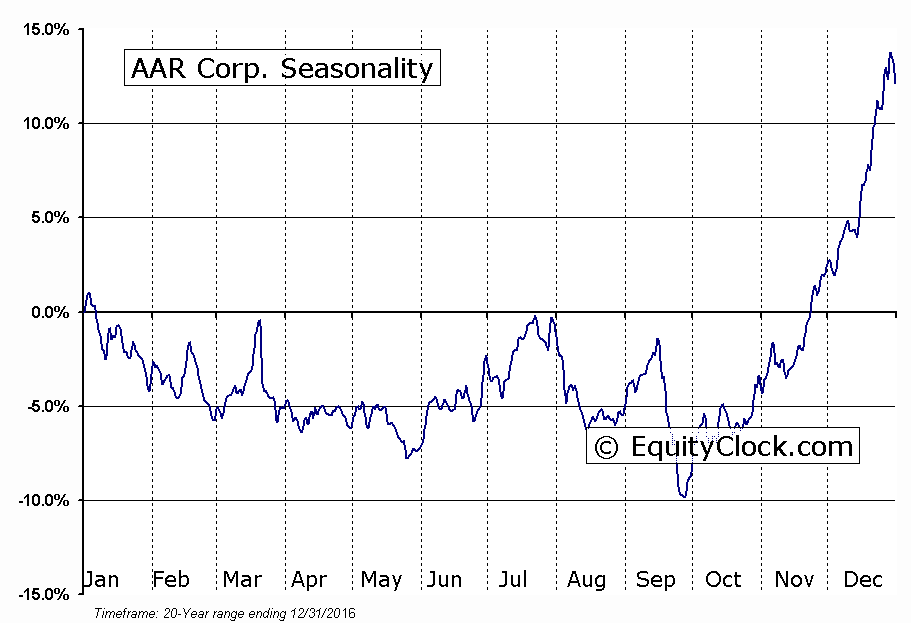
AAR Corp. (NYSE:AIR) Seasonal Chart
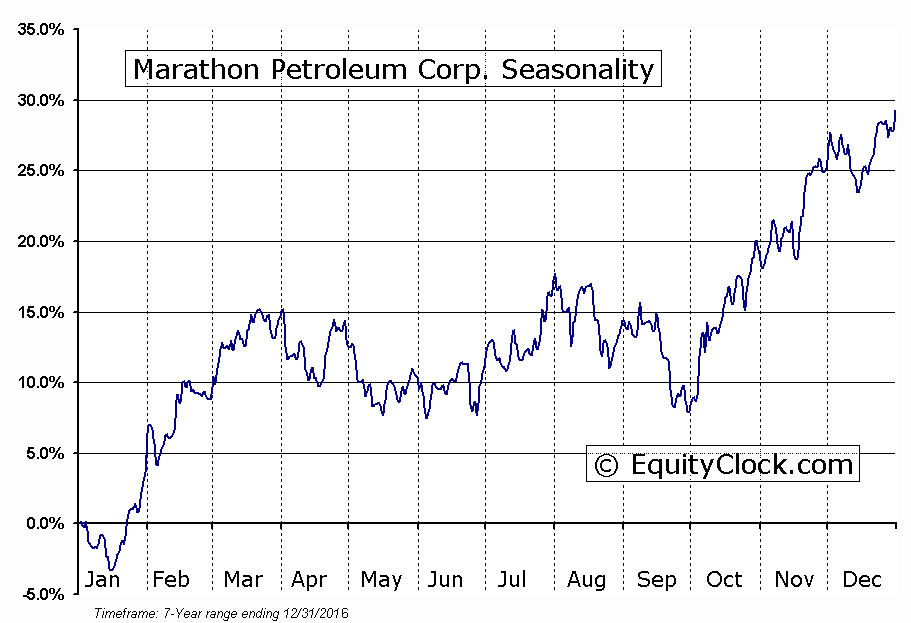
Marathon Petroleum Corp. (NYSE:MPC) Seasonal Chart
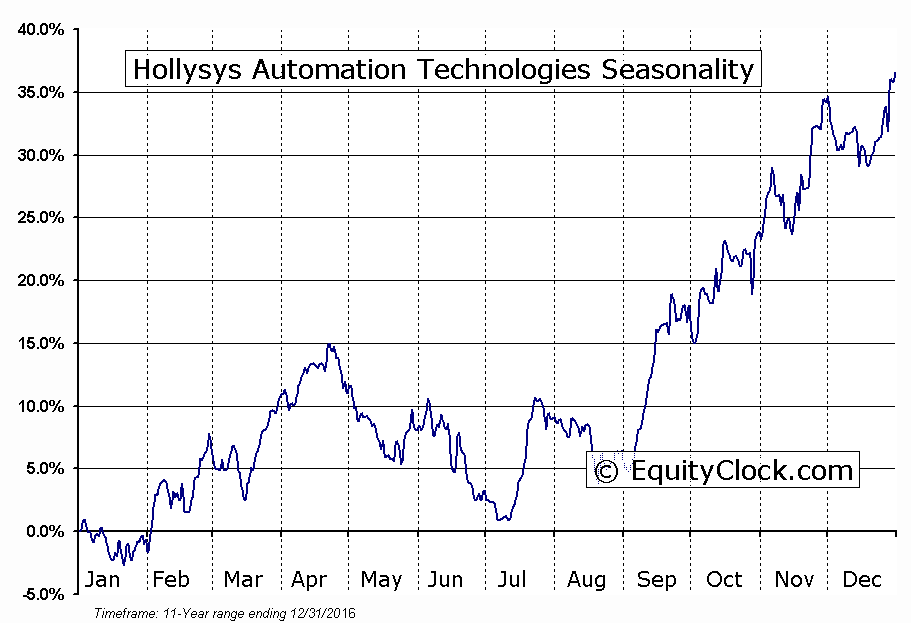
Hollysys Automation Technologies (NASD:HOLI) Seasonal Chart
Upcoming BNN Appearance:
I will be on BNN’s Market Call Tonight at 5:30pm ET this Friday, September 29th taking your calls on Technical Analysis and Seasonal Investing. CALL TOLL-FREE 1-855-326-6266, EMAIL marketcall@bnn.ca, or TWEET @MarketCall Be sure to send in your video questions for priority response on air.
The Markets
Stocks continue to inch higher, seeking to close out the month and the quarter on a positive note as investors digest the details of the Trump tax plan. The S&P 500 Index added just over one-tenth of one percent, charting a fresh closing high as materials and transports topped the leaderboard. The Dow Jones Transportation Average is testing trendline resistance that was highlighted the other day. However, if the momentum continues as it did with the Russell 2000 index, a breakout above trendline resistance could be near. The small cap benchmark surged above the equivalent rising level of resistance during Wednesday’s session, now turning this previous overhead hurdle into a potential level of support. The move on the Russell breaks a span that ranged from a low around 1340 to the high around 1450. Initial target on the upside is towards 1520 as the benchmark seeks to renew the positive long-term trend that was initiated in February of 2016. Investors are betting that these smaller, often domestically focussed, companies will see significant benefits from the Trump tax plan. As well, strength in the financial sector, which is the largest sector constituent in this index, is also acting as a benefit. Seasonally, tendencies for the small-cap Russell 2000 index relative to the large-cap S&P 500 Index turn positive in the month of November, just as the US Dollar Index tends to strengthen, acting as a headwind to relative performance of the large-cap, multi-national companies. The US Dollar Index is similarly breaking out, trading above its 50-day moving average for the first time since April.


$TRAN Relative to the S&P 500


^RUT Relative to the S&P 500


 Seasonal Chart")
DX.FUT Relative to the S&P 500


Briefly on the economic front, initial claims recorded a slight uptick last week, on a non-adjusted basis, as the effects of the recent hurricanes continue to play out in the labour market. Despite this, continuing claims actually fell, moving to the lowest level of the year. With continuing claims totalling 1.642 million, this is the lowest level since 1988 when the labor force was around three-quarters of what it is today. Obviously, the economy is reaching, if not already in, a state of full employment, implying that the economy is close to a peak given the present resources. Equity prices under this scenario can become much more variable, often leading the economic cycle as the chart from RBC Asset Management below suggests. But with hopes of tax reform and reduced regulation, investors are betting that the peak in the economic cycle is still well off in the future given the potential benefits that these initiatives will have. Nothing presently suggests that we have peaked or are peaking, but merely have reached a point where it becomes increasingly difficult to maintain the economic momentum that has been realized in recent months and years without some substantial catalyst to fuel it, such as the reduction in tax rates. Scrutiny of the economic data ahead is going to become increasingly important as we seek signs of the economy rolling over.


Source: RBC Asset Management
On to the weekly report of natural gas inventories, the EIA is indicating that stockpiles increased by 58 bcf last week. While well below the pace set in the past two weeks, relating to the impact of the recent hurricanes that hit the US, the build still exceeds the pace set last year when inventories increased by a more moderate 49 bcf during the second to last week of September. The price of natural gas traded lower following the result, once again struggling at its 200-day moving average. Support remains intact at the 50-day. Temperatures in the US north-east are expected to remain above average going into October, although well below the extremes recorded in recent days. This is expected to moderate demand, thereby presenting a neutral influence to the price of the commodity over the near-term. Seasonally, natural gas prices tend to rise between the start of September and the middle of December as traders bet on the high demand winter season.


 Seasonal Chart")
Sentiment on Thursday, as gauged by the put-call ratio, ended bullish at 0.73. Levels this low continue to suggest investor complacency.

Seasonal charts of companies reporting earnings today:
- No significant earnings scheduled for today
S&P 500 Index


TSE Composite


Copyright © EquityClock.com