by Ryan Detrick, LPL Research
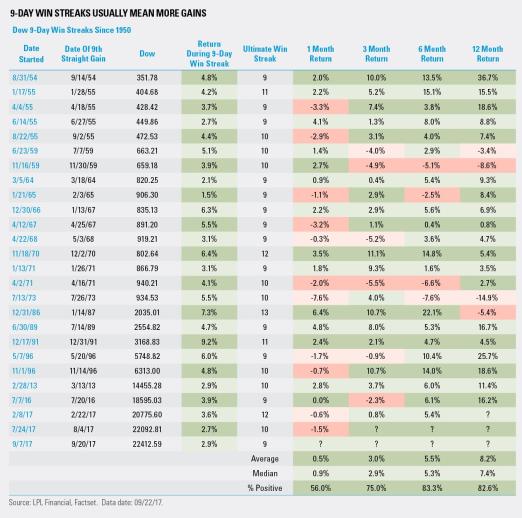
It’s been a record breaking year for 2017, but there’s still a whole quarter to go. Major U.S. indexes have marched steadily higher, but what makes this year different is that volatility has been nearly non-existent. The recent Dow win streak best sums this up. It was the third win streak of the year that stretched at least nine days, which is the most since 1955, yet it gained only 2.9%, making it one of the weakest returns during a nine-day win streak ever.
Looking more closely, during the last seven days of the Dow’s most recent nine-day winning streak, it gained less than 0.3% each day. The only other year since the Dow’s inception in 1896 to see a streak like that was in 1965. Not surprisingly, that was one of the least volatile years ever, and has many other similarities with 2017 so far.
Per Ryan Detrick, Senior Market Strategist, “2017 is going down as one of the least volatile years ever for equities. Only 1964, 1965, and 1995 match what we’ve seen so far this year. But remember, we still have three months left, and we wouldn’t be surprised to see volatility pick up in the fourth quarter.” Take a look at our latest Weekly Market Commentary for more of our thoughts.
Last, you might think nine-day win streaks suggest near-term weakness, but that isn’t always the case. In fact, going back to 1950, a month after a nine-day win streak, returns have been somewhat muted, but positive; but going out three and six months, the Dow was notably higher, on average.
IMPORTANT DISCLOSURES
The opinions voiced in this material are for general information only and are not intended to provide or be construed as providing specific investment advice or recommendations for any individual security.
Past performance is no guarantee of future results.
The economic forecasts set forth in the presentation may not develop as predicted.
Investing in stock includes numerous specific risks including: the fluctuation of dividend, loss of principal and potential illiquidity of the investment in a falling market.
Dow Jones Industrial Average is the most widely used indicator of the overall condition of the stock market, a price-weighted average of 30 actively traded blue chip stocks, primarily industrials. The 30 stocks are chosen by the editors of the Wall Street Journal. The Dow is computed using a price-weighted indexing system, rather than the more common market cap-weighted indexing system.
This research material has been prepared by LPL Financial LLC.
To the extent you are receiving investment advice from a separately registered independent investment advisor, please note that LPL Financial LLC is not an affiliate of and makes no representation with respect to such entity.
Not FDIC/NCUA Insured | Not Bank/Credit Union Guaranteed | May Lose Value | Not Guaranteed by any Government Agency | Not a Bank/Credit Union Deposit
Securities and Advisory services offered through LPL Financial LLC, a Registered Investment Advisor
Member FINRA/SIPC
Tracking #1-647997 (Exp. 09/18)
Copyright © LPL Research


