by Brad McMillan, CIO, Commonwealth Financial Network
Recently, there has been a great deal of discussion over oil prices—up, down, in a bear market, what is OPEC doing? So, let’s see what we can discern by applying our usual methods to the situation: evaluating changes over time, rather than in the short term; applying some historical perspective; and then looking at the fundamental economic realities to figure out what they mean now and in the future. I think you will find the results interesting.
Nominal oil prices
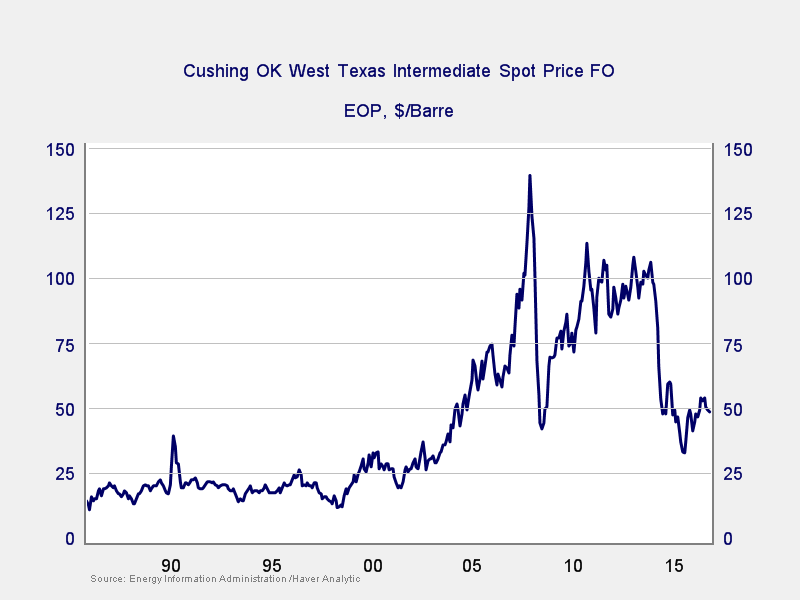
Let’s start with oil prices themselves. From the chart below, you can clearly see that prices were more or less stable through the 1990s. Then, they took off in the early 2000s, remaining at high levels (except for 2008–2009) through around 2013. At that point, they collapsed, although to levels well above those of the 1990s. Fair enough.

Real oil prices
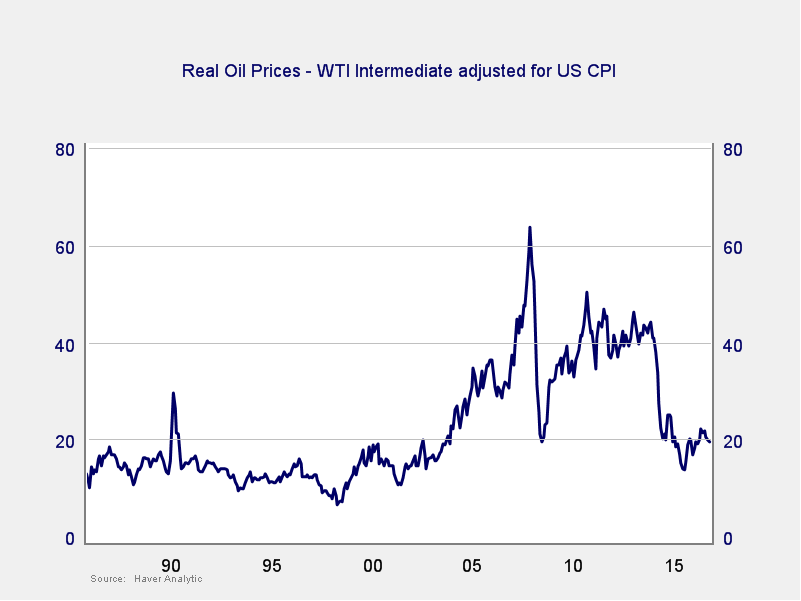
These, however, are nominal prices, which don’t include the effects of inflation. Given the length of time in the first chart, we need to adjust for the effect of higher prices overall, which I have done in the next chart. Here, we can see that, on a constant dollar basis, prices were stable in the 1990s, even decreasing a bit. They ran up in the 2000s and then collapsed back—although to a level much closer to the 1990s in real terms than in nominal terms.

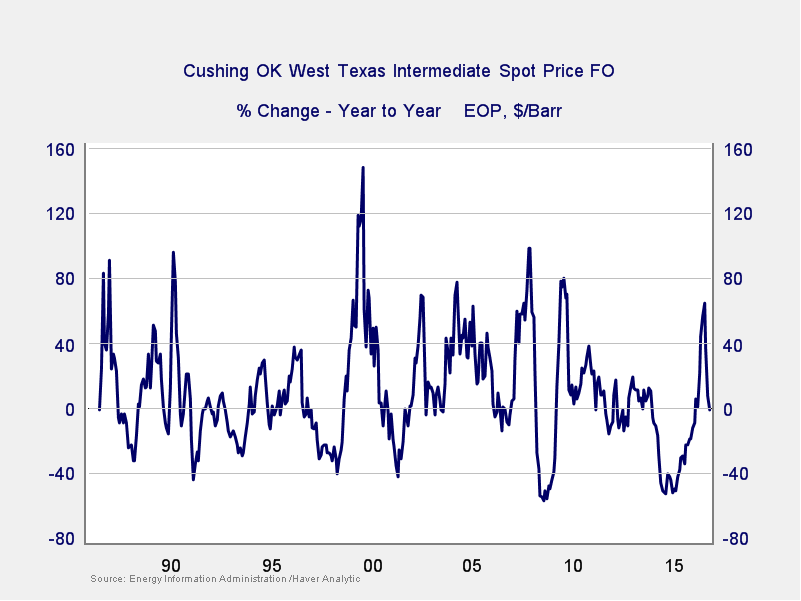
Another way to look at oil prices is to look at the changes over time, in the case of the chart below. We can see that extreme volatility is actually normal for the oil market. Price increases of 40 percent, year on year, have happened ten times over the past thirty or so years, and price decreases of nearly 40 percent have happened six times. Big price swings are quite common, and historically something we see every couple of years.

Armed with this data, what can we conclude about oil prices today? First, on an inflation-adjusted basis, oil prices have room to drop a bit further if they go back to 1990s levels. Second, after spikes in the price of oil, it has typically spent some time declining. This would suggest that, in the short term, further declines are possible—and not inconsistent with the long-term trend. In other words, over the next three to six months, oil prices may well continue to decline.
Does this make sense economically? I would argue that it does. With rising production here in the U.S., with OPEC having trouble restraining production (as it always has), and with systematic demand destruction continuing as cars become more efficient, the supply-demand equation keeps moving toward lower prices. U.S. producers will keep producing as long as they are profitable, and the current breakeven price is well below the actual price for many of them. They have no incentive not to grow production.
Oil as a market
This brings us to why the oil market is different this time—because it really is a market. Over the past several decades, markets have not set prices; producers have. Saudi Arabia and OPEC controlled enough production, and had a sufficient cost advantage, that they could decide where to set the price and consumers would have to pay. A high but stable oil price in the 1990s met everyone’s interest. Then, higher prices in the 2000s reflected the ability—and, then, desire—of the price setters to make more money. It’s more complicated than that, of course, but not all that much.
Now, of course, the U.S. is a major producer of oil. Because of that, the Saudis and OPEC can no longer set the price. The U.S. industry is fragmented and cannot try to join the cartel, so prices now have to reflect supply and demand. For the first time, oil is operating as a market.
Prices fluctuate, as we have seen, on new information and changes in the underlying fundamentals. This is normal, and good. In a competitive market, which we now have, prices decline to the marginal cost of production, which is exactly the process we are seeing now.
Will prices always be low? Of course not. In a competitive market, however, rising prices will drive increasing supply in a way that did not happen before. Again, this is exactly what we would expect to see in a market—and it is exactly what we are seeing right now.
Back to the future
A little over a year ago, I noted that I expected oil prices to bounce around between about $40 and $60 per barrel. That wasn’t a bad estimate, but I didn’t expect the cost improvements here in the U.S. Now, I suspect that range will remain between $35 and $55 per barrel—and might come down further. On a real basis, prices are moving back to the levels of the 1990s. So, is it different this time? It certainly is different than it has been for the past ten years. Bigger picture, though, it looks more like back to the future.
*****
Brad McMillan is the chief investment officer at Commonwealth Financial Network, the nation's largest privately held independent broker/dealer-RIA. He is the primary spokesperson for Commonwealth's investment divisions. This post originally appeared on The Independent Market Observer, a daily blog authored by Brad McMillan.
Forward-looking statements are based on our reasonable expectations and are not guaranteed. Diversification does not assure a profit or protect against loss in declining markets. There is no guarantee that any objective or goal will be achieved. All indices are unmanaged and investors cannot actually invest directly into an index. Unlike investments, indices do not incur management fees, charges, or expenses. Past performance is not indicative of future results.
Commonwealth Financial Network is the nation's largest privately held independent broker/dealer-RIA. This post originally appeared on Commonwealth Independent Advisor, the firm's corporate blog.
Copyright © Commonwealth Financial Network


