by Ryan Detrick, LPL Research
Productivity will need to play a key role to drive gross domestic product (GDP) growth in the coming years, as we recently discussed in our blog. This week, we look at the trend in S&P 500 firms’ use of cash over the past decade and why more granular analysis is necessary to identify which areas of the market are actually driving productivity growth.
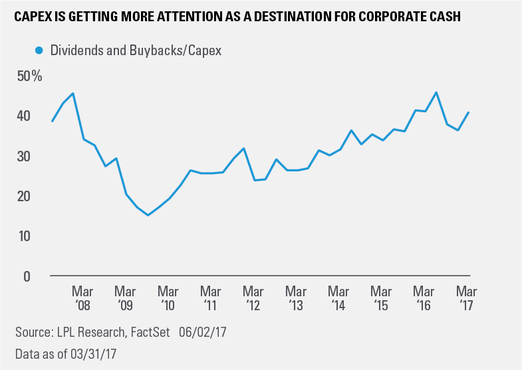
The chart below shows that, at the index level, S&P 500 firms’ preference for utilizing excess cash on their balance sheets to return money to shareholders via stock repurchases and dividends had been steadily increasing since the end of the Great Recession. That trend has reversed somewhat in recent quarters, as firms may be reinvesting cash in their businesses to increase productivity through the adoption of new technologies, investments in new equipment, and additional training and education to their employees, just to name a few examples.
But it’s important to understand how capex is being deployed to better determine which industries’ capital expenditures are supporting efforts to drive productivity gains. Let’s look at the healthcare sector as an example. Generally speaking, large cap pharmaceutical companies spend most of their capital on research and development (R&D) in hopes of developing a new drug. As a group, their spending on productivity improvements/efficiency gains is significantly less under most circumstances. In contrast, the healthcare equipment and technology space invests material amounts of capital in products and processes that either improve internal processes or can be sold to improve the productivity of other healthcare companies. This isn’t to say pharmaceuticals don’t have other investment merits; however, it shows that determining which market segments will likely drive productivity gains requires more granular analysis.
Increasing productivity will be key to GDP growth; tentative signs indicate that some firms may be placing a higher priority on it. Taken together, these companies and market segments could help to enhance not only shareholder returns by means such as increased profitability, greater market share, and a more skilled workforce, but also economic growth. However, investing in market segments leading this trend will likely require a more targeted approach.
*****
IMPORTANT DISCLOSURES
The economic forecasts set forth in the presentation may not develop as predicted.
The Standard & Poor’s 500 Index is a capitalization-weighted index of 500 stocks designed to measure performance of the broad domestic economy through changes in the aggregate market value of 500 stocks representing all major industries.
Investing in stock includes numerous specific risks including: the fluctuation of dividend, loss of principal and potential illiquidity of the investment in a falling market.
Gross Domestic Product (GDP) is the monetary value of all the finished goods and services produced within a country’s borders in a specific time period, though GDP is usually calculated on an annual basis. It includes all of private and public consumption, government outlays, investments and exports less imports that occur within a defined territory.
Indices are unmanaged and cannot be invested into directly. Unmanaged index returns do not reflect fees, expenses, or sales charges. Index performance is not indicative of the performance of any investment. Past performance is no guarantee of future results.
The opinions voiced in this material are for general information only and are not intended to provide or be construed as providing specific investment advice or recommendations for any individual security.
This research material has been prepared by LPL Financial LLC.
To the extent you are receiving investment advice from a separately registered independent investment advisor, please note that LPL Financial LLC is not an affiliate of and makes no representation with respect to such entity.
Not FDIC/NCUA Insured | Not Bank/Credit Union Guaranteed | May Lose Value | Not Guaranteed by any Government Agency | Not a Bank/Credit Union Deposit
Securities and Advisory services offered through LPL Financial LLC, a Registered Investment Advisor
Member FINRA/SIPC
Tracking # 1-613943 (Exp. 06/18)
Copyright © LPL Research


