For this week’s edition of the Equity Leaders Weekly, we are going to take a look at the Gold Continuous Contract (GC.F) and the recent performance of the S&P/TSX Venture Index (TSXV.I) given the large proportion of metals and mining names that comprise this Junior Cdn Index.
Gold Continuous Contract (GC.F)
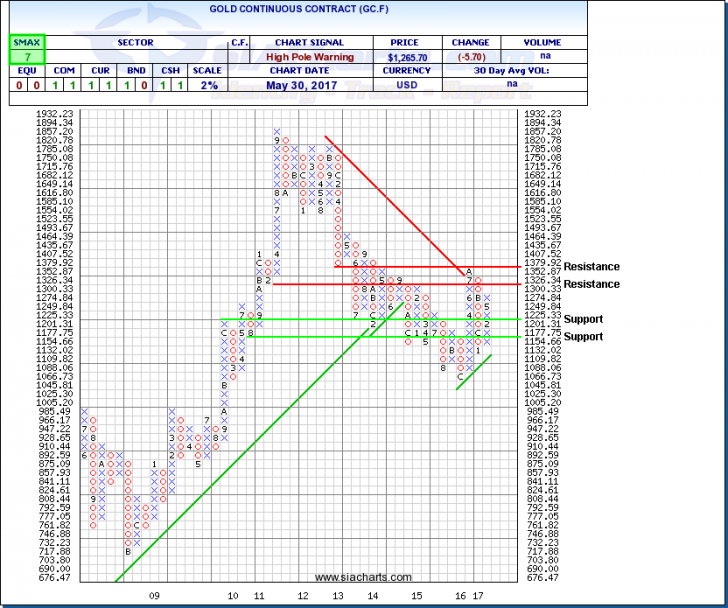
The last time we looked at Gold was on March 23rd. Gold has always been considered a “safe haven” play in times of increased uncertainty. What we are seeing now is no different with increased geopolitical tensions heightened. We have seen Gold Bullion firm up since February of this year. In looking at the attached chart, we see gold is currently in a column of X’s. It is quickly approaching resistance at $1326.00. If it manages to break above that level, the next resistance point is at 1379.00. Support for gold can be found at $1201.00 and, below that $1154.00. Will this geopolitical uncertainty continue? Only time will tell. It will also be interesting to see what direction the U.S. Federal Reserve takes on its interest rate policy when they next meet in Mid-June as interest rate hikes may lead to a stronger U.S. dollar which may suppress the price of Gold Bullion. With an SMAX of 7, gold is showing near term strength against most asset classes.
S&P/TSX Venture Composite Index (TSXV.I)
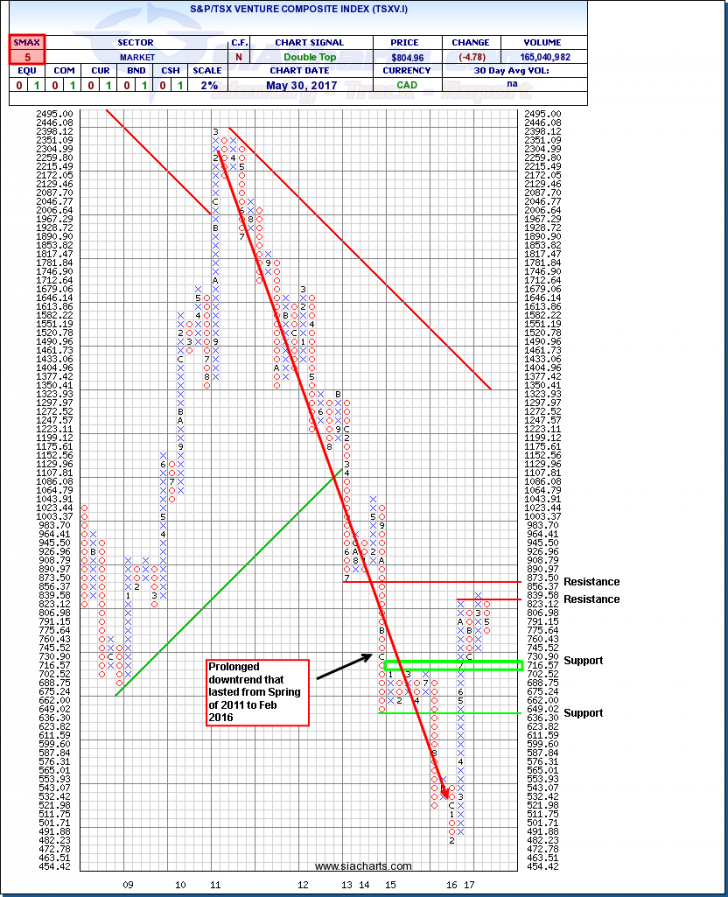
The last time we looked at the TSX Venture Composite Index was back on Aug 18, 2016. Let’s re-examine the TSX Venture to see what has transpired since we last looked at it. In looking at the attached chart, we see that the TSX was in a prolonged downtrend which started in the Spring of 2011 and lasted up until February of 2016. However, since that time we seen a strong rebound from February 2016 up until October of last year. Since October the index has consolidated somewhat into a sideways trading range and that consolidation pattern remains intact today. Strong support for TSXV.I can be found at the 702.52 to 716.57 area. However, if it does not hold this support level, the next level of support will not be until 636.50. To the upside, resistance can be found at 839.58. If it manages to break above this level, the next area of resistance is at 873.50.
As we know, the Venture is comprised of predominately mining exploration and oil and gas exploration names. In fact, 70% of the index is exposed to these two sectors alone with 57% of the names exposed to metals and mining. It will be interesting to see what direction the Venture takes whether that being to the upside or the downside. Needless to say, the price action of the underlying commodities such as Gold will have an impact on which direction the index will resolve to. With an SMAX of 5 out of 10, The Venture is not showing any near-term strength against the other asset classes.
For a more in-depth analysis on the relative strength of the equity markets, bonds, commodities, currencies, etc. or for more information on SIACharts.com, you can contact our sales and customer support at 1-877-668-1332 or at siateam@siacharts.com.
SIACharts.com specifically represents that it does not give investment advice or advocate the purchase or sale of any security or investment. None of the information contained in this website or document constitutes an offer to sell or the solicitation of an offer to buy any security or other investment or an offer to provide investment services of any kind. Neither SIACharts.com (FundCharts Inc.) nor its third party content providers shall be liable for any errors, inaccuracies or delays in content, or for any actions taken in reliance thereon.