How thinking small could uncover value
by Dr. Brian Jacobsen, CFA, CFP®, Wells Fargo Asset Management
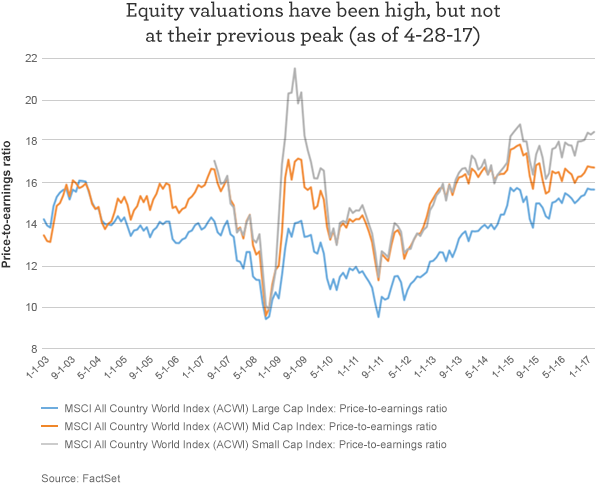
Where in the world is there value? Potentially everywhere, if investors are willing to look. Valuation metrics may be fraught with problems, but a popular one involves looking at a stock’s price-to-earnings ratio (P/E) using forward-looking earnings. This metric is the share price of a stock divided by earnings per share, calculated using consensus expectations for the next 12 months earnings. On that basis, things might look pricey. But it’s important for investors to unpack the reasons why things are pricey.
The first reason equity valuations might look pricey could be due to flaws in the chosen valuation metric. During times of change, are investors really focusing on the next 12 months earnings, or are they looking out further? Since the U.S. presidential election, consensus earnings expectations have only risen about 5% for the S&P 500 Index and 4.7% for the Russell 2000 Index. To the extent that investors are thinking we could get a nice growth boost from tax or regulatory reform, that expectation might not be showing up in the consensus earnings numbers. This is probably because analysts—the ones who are surveyed to get the consensus—are typically hesitant to revise their earnings expectations on the basis of reforms whose content and implementation timeframe are uncertain.
The second reason is a problem of aggregation. Even if an index’s underlying individual stocks are cheap, the index can appear expensive because the largest market capitalization stocks are pulling up the average, or because the index contains stocks with outlier valuations. Within the global small cap stock universe, for example, the P/E ratio of the health care sector is close to 110 times the sector’s next 12 months earnings. That’s unusually and extremely high. However, small cap health care stocks are typically valued on the basis of their research pipeline, and not on the basis of near-term earnings. In this case, the aggregation of all stocks in an index skews the market’s perception of all global small caps as being overpriced or overvalued, when that’s not the case.
Small cap energy stocks are trading at over 56 times their next twelve months earnings. That’s also high, but energy earnings have been notoriously cyclical with the P/E being more noise than a signal.
Even within any given sector, not all stocks trade with the same valuations. Within the 187 stocks in the MSCI World Consumer Staples Index—which have analyst coverage to generate a consensus twelve month forecast of earnings—the P/Es range from a low of 5.5 to a high of 917. Within the diversity, great opportunity may still be found. The key is not only knowing where, but knowing how, to look for it.
For more insights on the global small cap space, investors can check out this blog post.


