The Deck is Stacked: Putting Risk and Reward into Perspective
by Michael Lebowitz, CFA, 720 Global Research
“The individual investor should act consistently as an investor and not as a speculator.“ – Ben Graham.
We are frequently told that valuation analysis is irrelevant because fundamentals do not signal turning points in markets. Scoffers of valuation analysis are correct, as there is no fundamental statistic or for that matter, technical or sentiment indicator that can provide certainty as to when a market trend will change direction.
Despite being humbled by recent market gains and the difficulties associated with timing the market to call a precise top, we remain resolute about the merits of a conservative investment posture at this time. At some point, current equity market valuations will succumb to financial gravity and the upward trend of the last eight years will reverse. When that day arrives, it will not be because a valuation ratio hit a certain level or because the market formed a well-known technical pattern. It will simply be the day that selling pressure overcomes demand.
In prior articles, we compared the current economic landscape to the early 1980’s. Let’s revisit that contrast to further quantify the risk and reward associated with the U.S. stock market during both time periods.
As Graham so eloquently stated, speculating and investing are two vastly different endeavors, and we prefer the practice of investing.
Risk-Return Tradeoff
Investors contemplating a new investment or evaluating an existing holding are typically faced with two basic but essential questions:
- How much of my wealth am I willing to risk?
- What returns do I expect in exchange for that risk?
When Ronald Reagan took office in 1981, investors needed to evaluate whether his fresh economic policies could spur sustainable economic growth. In the decade preceding his election, the economy was hampered by significant inflation, double-digit interest rates, and a steadily rising unemployment rate. The Dow Jones Industrial Average (DJIA), essentially flat over the prior decade, was resting at levels similar to those seen 17 years earlier in 1964. Valuations over this period were equally stagnant, with the Cyclically Adjusted Price to Earnings (CAPE) ratio, as an example, ranging between 7 and 9. Despite the bargain basement equity prices, few investors believed that market trends would reverse. Equity valuations had been low and falling for so many years to that point, the trend became a permanent state in many investors’ minds by way of linear extrapolation.
Contrast that with today. As in early 1981, there is a new president in office with a non-typical background presenting non-conventional economic ideas to aid a struggling economy. Unlike Reagan, however, public support for Donald Trump is marginal. Trump was not elected by a majority, he lacks Reagan’s humility, optimism, good humor and diplomacy and his approval rating historically ranks among the worst of incoming presidents. Additionally, while Reagan’s and Trump’s economic policies may have similarities, there are stark differences between the economic landscapes that prevailed in the early 1980s and today. (Please read The Lowest Common Denominator for a full write up on what the current administration is up against.)
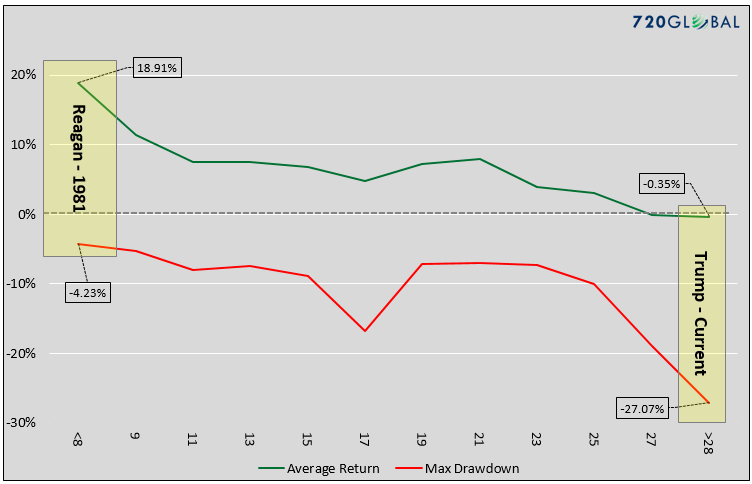
Equity investors betting on Reagan in 1981 were investing in an environment where the probabilities of success were asymmetrically high. With Cyclically Adjusted Price-to-Earnings (CAPE) ratios below 10, investors could buy in to a stock market whose valuation on this basis had only been cheaper 8% of the time going back to 1885. Given the likelihood of success as inferred from valuations, investors did not need much help from Reagan’s policies. Current equity market valuations require investors to believe beyond all doubt that Trump’s policies can produce strong economic growth and overcome hefty economic and demographic headwinds. More bluntly, the risk-return profile of 1981 is the polar opposite to that of today. To highlight this stark difference, the following graph compares five-year average total returns and the maximum draw downs that have occurred over the last 60 years at associated CAPE readings.
Data Courtesy: Robert Shiller -http://www.econ.yale.edu/~shiller/data.htm
Based on the graph above, investors in the first years of Reagan’s presidency should have expected annual returns, including dividends, of nearly 20%, while simultaneously risking a maximum drawdown of less than 5%. Today, investors should expect returns over the next five years, including dividends, to be near zero. Worse, during the next five years the S&P 500 is likely to experience a drop of nearly 30%. That is quite a risk investors are shouldering for a return they can easily attain with a risk-free 5-year U.S. Treasury note.
Fire Sale
Beyond the obvious, there are a couple of problems with the current risk-return profile. In a best case scenario, it is likely an equity investor will earn a return that could be attained by putting cash under one’s mattress. Although it occurred an eternal nine years ago, the financial crisis of 2008, is still a faint memory for investors. If the market does indeed drop by 30%, will investors keep their cool and not sell? If they do sell, they will lock in a permanent loss. One of the demographic headwinds we have discussed in prior articles is the growing number of retirees that are heavily reliant on their retirement accounts to meet their living expenses. Will they be able to keep their collective heads under the duress of a major correction? What if prices do not rebound as quickly as they did in the post-financial crisis years?
The hard truth of this scenario is that humans always panic when faced with severe market drawdowns. The back-testing of “what-if” scenarios for buy-and-hold analysis are irrelevant because investors do not HOLD – they sell, and usually at the worst time after abandoning all hope for a durable bounce. The anxiety that retirees will face in such a scenario, many of whom can barely maintain their standard of living on an optimistic outlook, will be paralyzing.
Summary
If someone were to offer you a unique investment opportunity forecast to pay 0% annual returns over the next five years, would you sign up? What if they added that, at some point over that period, the value of your investment may drop by 30%? High volatility, low return investments do not get serious attention among even the most foolish of investors, so we would venture to guess there would be very few takers.
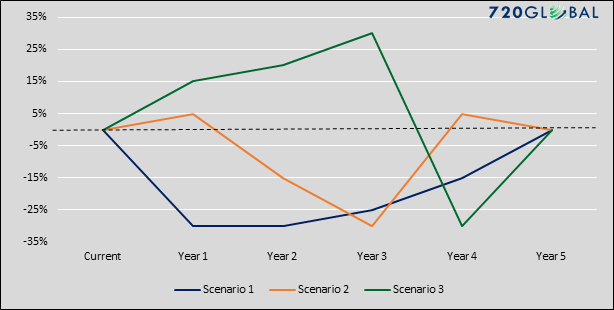
Interestingly, based upon the CAPE analysis above, the U.S. stock market is currently offering that very same probability of return and risk and buyers cannot seem to get enough. Given these dynamics, not only is investor behavior perplexing, it seems to us altogether incoherent which in our view provides further evidence bubble behavior is upon us. For the sake of illustration, the graph below provides three random scenarios showing how such an expected return and drawdown could play out over the next five years. None of these, nor the infinite myriad of other possible paths, appeal to us.
In a sinister rhyme to that of the early 1980’s, equity market valuations have been rising so steadily for so many years now that the trend has become a permanent state in many investors’ minds. The “investors” identified in Ben Graham’s quote do not acquiesce to the crowd or bet on whims. Instead, they carefully assess an investment’s potential risk and expected return to make calculated decisions. The virtue of this time-honored practice of cost-benefit analysis does not reveal itself every day but avoiding the pitfalls, even if it means foregoing additional speculative gains, has a long and proven track-record of compounding wealth over time.
Michael Lebowitz, CFA

Investment Analyst and Portfolio Manager for Clarity Financial, LLC. specializing in macroeconomic research, valuations, asset allocation, and risk management. RIA Contributing Editor and Research Director. Co-founder of 720 Global Research.
Follow Michael on Twitter or go to 720global.com for more research and analysis.


