
by Nathan Faber, Newfound Research
This post is available as a PDF download here.
- Market expectations are a key input in the portfolio construction process. These expectations can be either qualitative or quantitative.
- How to form expectations for more complex strategies (e.g. managed futures, covered calls, and alternatives) is often less straightforward than forming expectations for single asset classes (e.g. large-cap equities, gold, and long-term U.S. Treasuries).
- In the case of tactical equity strategies, periods of large absolute changes in the equity market and positive interest rate changes have historically created favorable performance versus a balanced stock/bond allocation. These factors can give context for setting expectations.
- While we cannot predict the future, we know that volatile markets happen frequently and that interest rates have already begun to increase.
- Having a robust, tactical equity solution can add value by equipping a portfolio for volatility and rising rates without sacrificing gains to whipsaw events.
Expectations are critical for any investment, and they can be expressed in many different forms.
For instance, when we construct our QuBe strategic portfolios, expectations for returns, volatilities, and correlations are critical input parameters.
We also expect that these inputs will not be 100% accurate. We account for this by using multiple data sources and stress testing the parameters to generate a rich array of market environments. The result is a robust portfolio that we would expect to weather more severe market scenarios, especially after further diversifying the processes within many asset classes in our final implementation.
Now let’s ask a more complicated question.
What is your expectation for a covered call strategy? Managed futures? Event driven alternatives?
These strategies have multiple components to consider, and complexity makes the exercise less straightforward. But with the emphasis on suitability of investments, having appropriate expectations is still essential.
Without appropriate expectations, how can we accurately gauge the risk of loss, the prospect of gains, or potential interaction effects with other investments?
With tactical equity strategies, the market environment can be a good indicator of what to expect.[1]
Tactical Equity in a Nutshell
To do some analysis, we will start simple.
Let’s construct a tactical equity strategy that invests in the S&P 500 when its 50-day simple moving average (SMA) is above its 200-day SMA. The strategy will invest in 1-3 month T-bills when the SMAs are reversed.
This simple, systematic strategy has historically exhibited strong positive returns with reduced risk relative to the S&P 500, as readers of this commentary are by now well aware. It has also done well versus a 50/50 blend of the S&P 500 Index and the Barclays Aggregate Bond Index (“balanced benchmark”).[2]
| S&P 500 | Balanced Benchmark | Tactical Equity | |
| Annualized Return | 9.7% | 8.3% | 9.3% |
| Annualized Volatility | 17.8% | 8.5% | 12.4% |
| Maximum Drawdown | 55.3% | 27.8% | 19.2% |
Source: Morningstar. Calculations by Newfound Research. Data from 11/15/1989 to 3/31/2017. Past performance is not a guarantee of future results.
However, the million dollar question is always, “how will this investment do in the future?”
The Context of the Market
There are many ways to categorize the market environment into different regimes. For investors with traditionally built portfolios of stocks and bonds, factors often at the forefront of their minds are returns in equities and changes in interest rates.
To evaluate how our toy tactical equity strategy performs, we can bucket these two variables into quintiles. For equities, we will look at the one-year absolute returns of the S&P 500. For interest rates, we will look at the one-year change in the 10-year U.S. Treasury rate.
The reason we look at absolute returns for equities is because we expect a tactical strategy to do well when there are large trends, regardless of direction. On the other hand, in interest rates we take the sign of the change into account as we want to capture the headwind or tailwind it creates for the balanced benchmark portfolio.
Equity Moves
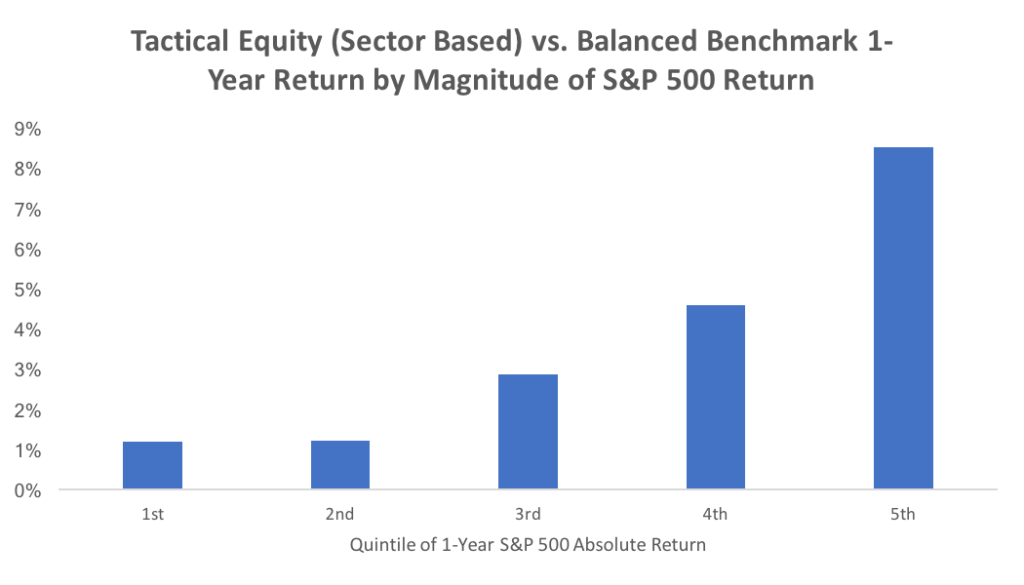
The chart below shows the one-year performance of the tactical equity strategy relative to that of the balanced benchmark for different magnitudes of 1-year S&P 500 moves.

Source: Morningstar. Calculations by Newfound Research. Data from 11/15/1989 to 3/31/2017. Past performance is not a guarantee of future results.
In low return (either positive or negative) environments for equities, the tactical strategy lags the balanced benchmark as whipsaw costs add up. As the equity moves become larger in magnitude, the tactical strategy outperforms the static stock/bond blend since the tactical strategy more effectively captures these moves with less whipsaw.
Interest Rate Moves
The following chart shows the one-year performance of the tactical equity strategy relative to that of the balanced benchmark for different 10-year U.S. Treasury changes.

Source: Morningstar and St. Louis Fed. Calculations by Newfound Research. Data from 11/15/1989 to 3/31/2017. Past performance is not a guarantee of future results.
In this graph, we see that the tactical equity strategy outperformed the balanced benchmark more when interest rates rose as the increasing interest rates were a headwind to core bonds.
Joint Equity and Interest Rate Moves
To dive deeper into these periods of outperformance, we can decompose each quintile in S&P 500 returns based on its overlap with changes in the 10-year U.S. Treasury rate.
First, we can look at the coverage of each quintile overlap. That is, have interest rate increases occurred more frequently in high or low absolute equity return environments, or vice versa?
Quintile Overlap of Rolling 1-Year S&P 500 Returns and Changes in the 10-Year U.S. Treasury Rate
Source: Morningstar and St. Louis Fed. Calculations by Newfound Research. Data from 11/15/1989 to 3/31/2017. Past performance is not a guarantee of future results.
Since there are 25 possible regimes in this two dimensional grid, 4% in each box would indicate a completely even distribution. We see that the overlap in the extremes of both variables (the four corner boxes) has been more frequent, as have middle-of-the-road changes, which have occurred together the most frequently.
The reasonable coverage in all of the regimes (i.e. none are less than 2%) allows us to assess the distribution of relative returns in each. The table below shows the median return in each regime.
Tactical Equity vs. Balanced Benchmark 1-Year Return by Quintiles of Rolling 1-Year S&P 500 Returns and Changes in the 10-Year U.S. Treasury Rate
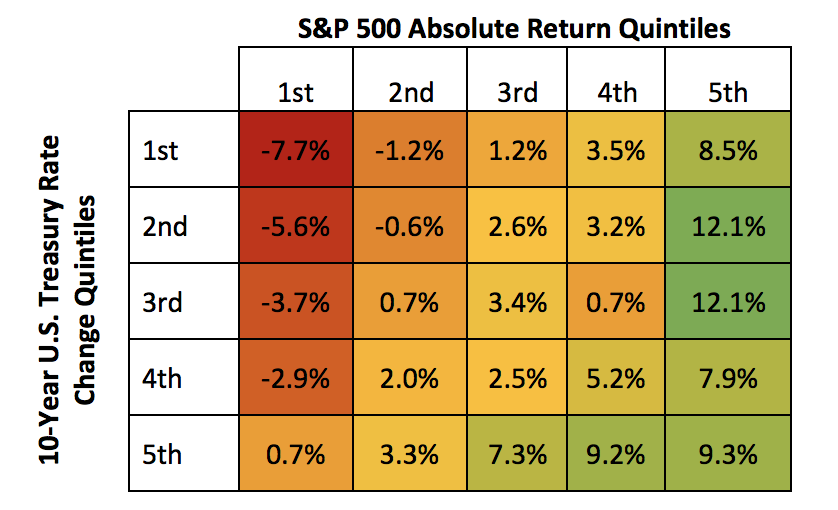
Source: Morningstar and St. Louis Fed. Calculations by Newfound Research. Data from 11/15/1989 to 3/31/2017. Past performance is not a guarantee of future results.
As we saw previously, markets with small equity moves (left side of the table) are unfavorable to the tactical equity strategy. When you have small equity moves and declining rates: watch out.
However, increasing interest rates, even in these small equity market move periods, can provide enough of a headwind to the balanced benchmark to push tactical equity back to the forefront.
A More Granular Tactical Equity Strategy
Going beyond the simple broad index-based tactical equity strategy, what would happen if we instead invest via sectors?
Below we show the results for a tactical equity strategy using the same moving average trend indicator, but now on each the nine primary S&P 500 sector indices. We construct the portfolio in a similar fashion to our Risk Managed Sector Series strategies, by equally weighting each sector with a positive momentum signal up to a 25% cap (which has the effect of building cash in the portfolio when three or fewer sectors are exhibiting positive trends).
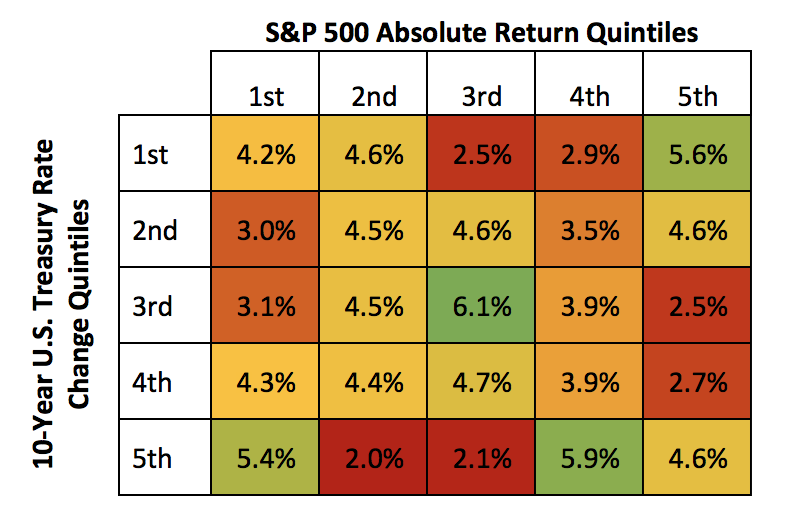
 Source: Morningstar. Calculations by Newfound Research. Data from 7/5/1990 to 3/31/2017. Past performance is not a guarantee of future results.
For smaller absolute equity moves, we see an improvement in the sector based strategy versus the simpler strategy on only the S&P 500 as the nine sectors provide opportunities to manage model risk. That is, when a signal leads to whipsaw in one sector, an accurate signal in a different sector can mitigate the impact.
We can compare the benefits of this approach against the broad index approach by calculating the differences per quintile.

Source: Morningstar. Calculations by Newfound Research. Data from 7/5/1990 to 3/31/2017. Past performance is not a guarantee of future results.
We can see that the benefit decreases as the magnitude of the S&P 500 change increases. In fact, the sector approach appears to be a drag compared to the single broad index approach for the largest moves.
Let’s now look at the impact of the sector-based design on returns versus 1-year changes in interest rates.

Source: Morningstar and St. Louis Fed. Calculations by Newfound Research. Data from 7/5/1990 to 3/31/2017. Past performance is not a guarantee of future results.
Again, we can see an improvement in the bottom quintiles.

Source: Morningstar and St. Louis Fed. Calculations by Newfound Research. Data from 7/5/1990 to 3/31/2017. Past performance is not a guarantee of future results.
For changes in interest rates, there was a benefit to using sectors relative to the strategy with only the S&P 500 across the board.
Conclusion
Including an asset in a portfolio without understanding which market environments will be favorable or not is a recipe for disaster. If losses occur, uncertainty can lead to poor decisions that compound losses, which can then lead to further emotion-driven decisions.
As Peter Lynch said, “Know what you own, and know why you own it.”
We own tactical equity strategies in an effort to manage the risk of large market drawdowns without sacrificing substantial gains during bull markets.
Tactical equity strategies have historically outperformed balanced portfolios during large swings in the equity markets and in rising rate environments. In sideways markets, whipsaw has typically led to underperformance. However, there are ways to manage whipsaw risk and smooth out the ride even in tougher market environments. For example, diversifying across the sectors has historically improved the outcome as whipsaw calls in one sector could be offset by accurate calls in another sector.
Knowing what to expect with tactical equity can lead to better long term results as investors learn how to better utilize tactical equity within their portfolios, both from a quantitative and behavioral perspective.
[1] We wrote a commentary entitled How Not to Ditch Your Investment Plan on setting expectations in a Multi-Asset Income portfolio. Many of the techniques we discussed there are applicable to any strategy.
[2] This benchmark was chosen because it represents what an investor might replace with the tactical equity strategy. This swap acts as a dial for equity exposure. If we were instead evaluating the tactical strategy to see how well the momentum signals worked, we would benchmark it to a 50/50 mix of the S&P 500 and 1-3 month T-bills. Benchmarking can depend on what aspect of a strategy you are analyzing.