by Lance Roberts, Clarity Financial
In this past weekend’s newsletter, I discussed the relatively “weak” breakout of the market to new record highs. To wit:
“Over the last few weeks, I have been discussing the ongoing consolidation process for the S&P 500 from the March highs. (For a review read: “Oversold Bounce Or Return Of The Bull,” and “Return Of The Bull…For Now.”) As the expected rally in stocks, and reversal in bonds, took shape as the S&P 500 was finally able to ratchet a record close at 2399.29. (Read: 10/2016 – “2400 Or Bust”)
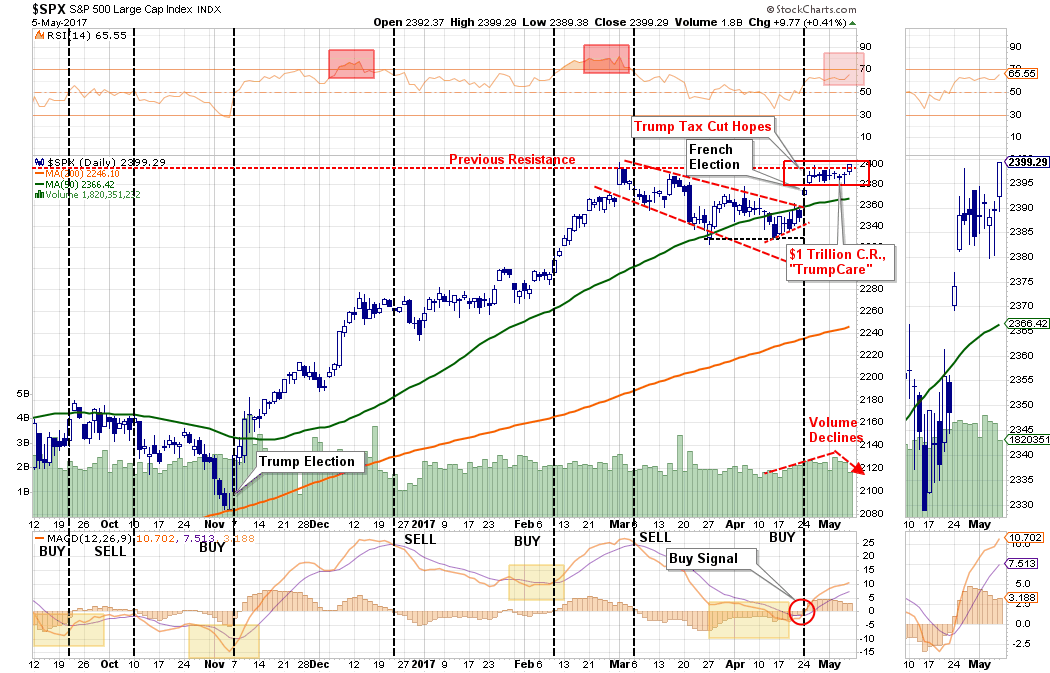
“With the market on a short-term ‘buy signal,’ deference should be given to the probability of a further market advance heading into May. With earnings season in full swing, there is a very likely probability that stocks can sustain their bullish bias for now.
The market did do exactly that this past week, and while hitting a new high, as noted above, it was a ‘weak’ breakout as volume contracted.”
The question for the bulls, of course, is whether the current “breakout” is sustainable, or, is it a “fakeout” that reverses back into the previous trading range? As Steve Reitmeister from Zack’s Research suggested on Monday:
“I would say it all depends on investor confidence that tax breaks are on the way.”
It all hangs on just one issue.
As I have discussed previously, there is a huge risk with respect to the timing and extent of tax reform there will be.
“Given the current problems in Washington D.C. in getting legislative agenda agreed to by Congressional Republicans, delays should be expected.”
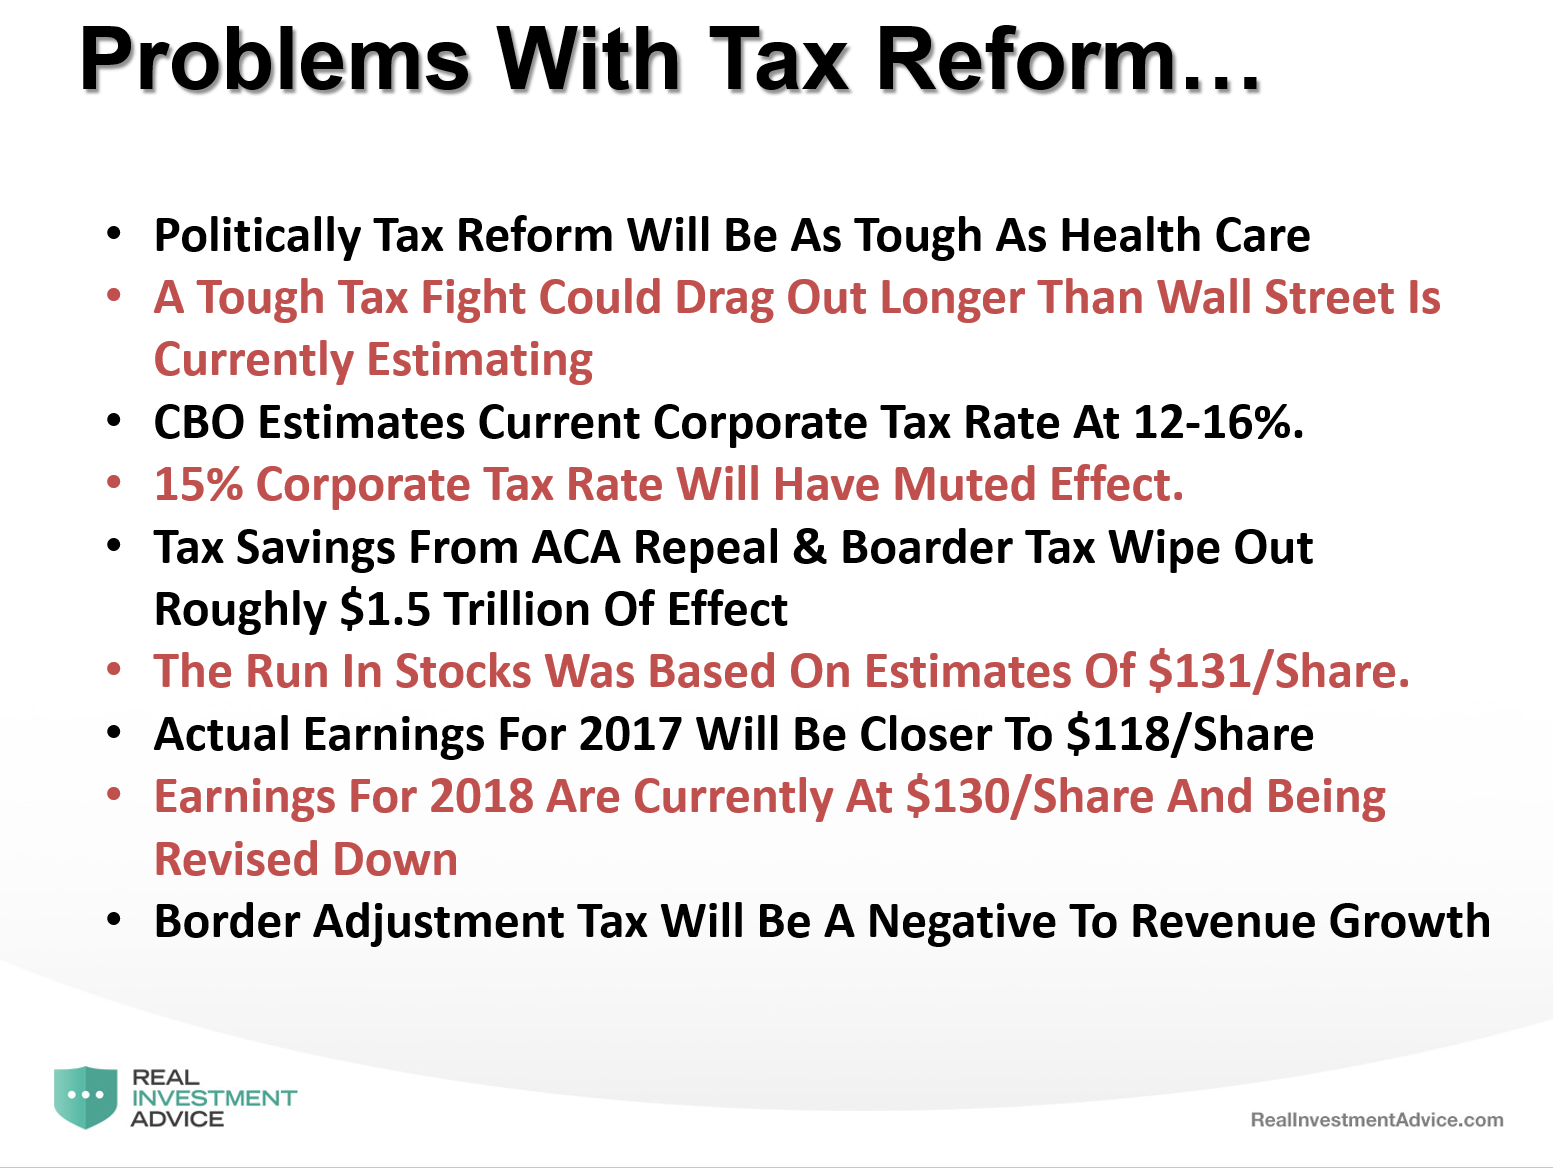
“The question, of course, is just how much time the markets will give Washington to make progress on legislative agenda? As noted above, the estimates currently driving stocks were based on tax cuts being brought through to boost bottom line profitability. If those cuts don’t happen soon, earnings disappointments may bite investors.”
It is that potential for disappointment given the overly bullish earnings estimates which poses the greatest risk to investors given the currently elevated levels of valuations.
There is no arguing corporate profitability improved during 2016 as oil prices recovered. The recovery in oil prices specifically helped sectors tied to the commodity such as Energy, Basic Materials, and Industrials.
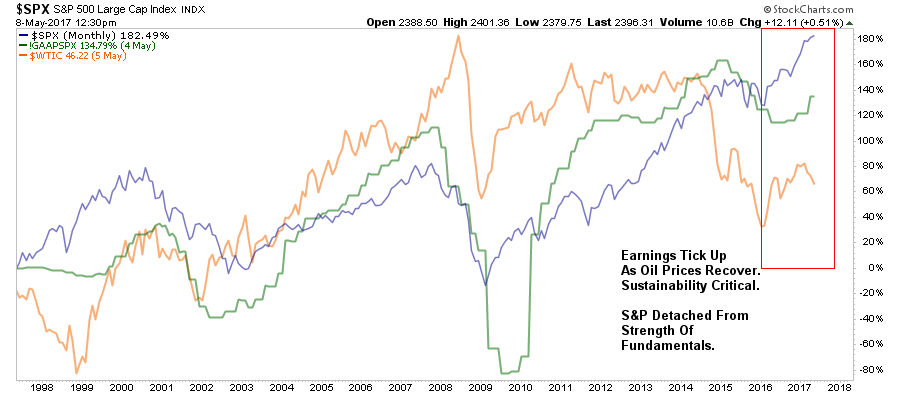
Currently, while earnings have ticked up modestly with the recovery in oil prices, the price of the S&P 500 has moved substantially more than the earnings recovery would justify.
Furthermore, the recovery in earnings, without the direct bottom line impact from tax cuts, may be fleeting as the dollar remains persistently strong.
Of course, we already know much of the rise in “profitability,” since the recessionary lows, has come from a variety of cost-cutting measures and accounting gimmicks rather than actual increases in top line revenue. As shown in the chart below, there has been a stunning surge in corporate profitability despite a lack of revenue growth.
Since 2009, the reported earnings per share of corporations has increased by a total of 221%. This is the sharpest post-recession rise in reported EPS in history. However, that sharp increase in earnings did not come from revenue which is reported at the top line of the income statement. Revenue from sales of goods and services has only increased by a marginal 28% during the same period.
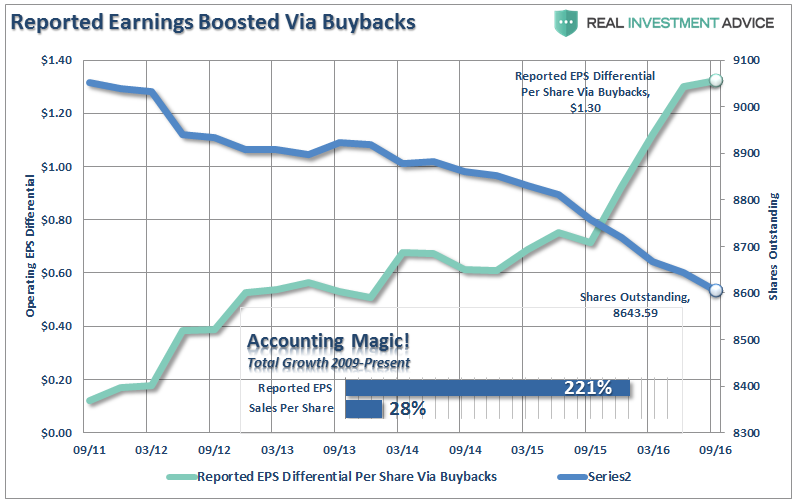
In order for profitability to surge, despite rather weak revenue growth, corporations have resorted to four primary weapons: wage reduction, productivity increases, labor suppression and stock buybacks. The problem is that each of these tools creates a mirage of corporate profitability which masks the real underlying weakness of the overall economic environment. Furthermore, each of the tools used to boost EPS suffer from both being finite in nature and having diminishing rates of return over time.
Of course, given the weakness in revenue growth, it is not surprising the markets are anxiously awaiting “tax cuts” which are a direct injection into bottom line earnings per share.
Importantly, it should be remembered that “tax cuts” will impact “earnings growth” rates for JUST ONE YEAR.
Let me explain:
- Year-1 earnings = $1.00 per share.
- Tax cuts add $0.30 per share in bottom lines earnings.
- Year-2 earnings = $1.30 per share or 30% growth.
- Year-3 earnings growth (assuming no organic growth) = $1.30 per share or 0% growth.
While tax cuts are certainly welcome as a boost to bottom line earnings, it should be remembered earnings growth must be sustained indefinitely to justify valuations at current levels.
Such is unlikely to happen.
With the Senate getting ready to scrap Congresses “AHCA” bill, and write their own plan which will then have to go back to Congress where the debates will begin again, it will likely take MUCH longer to get to tax reform than currently expected.
The problem, technically is that while the stock market is continuing to push higher, the internal strength continues to diminish as shown by both the number of stocks on bullish buy signals and the number trading above their respective 200 day moving averages.
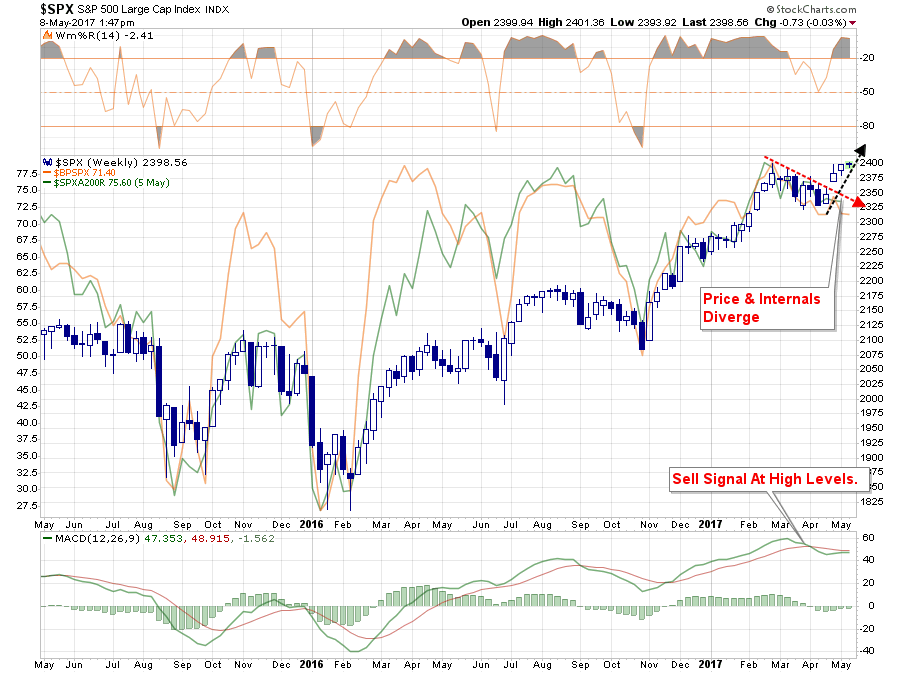
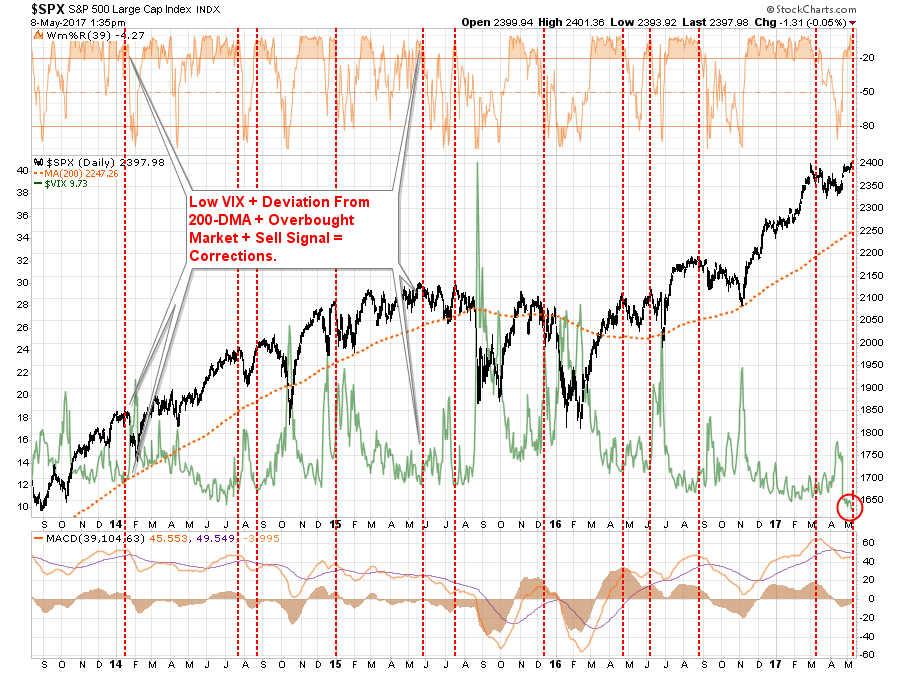
Furthermore, with the volatility level now pressed to its lowest levels since 2007, combined with an extreme overbought condition, a sell signal at a high level, and a large deviation from the 200-dma, the risk of a short to intermediate-term correction has risen markedly.
S&P 3000…Or 1500
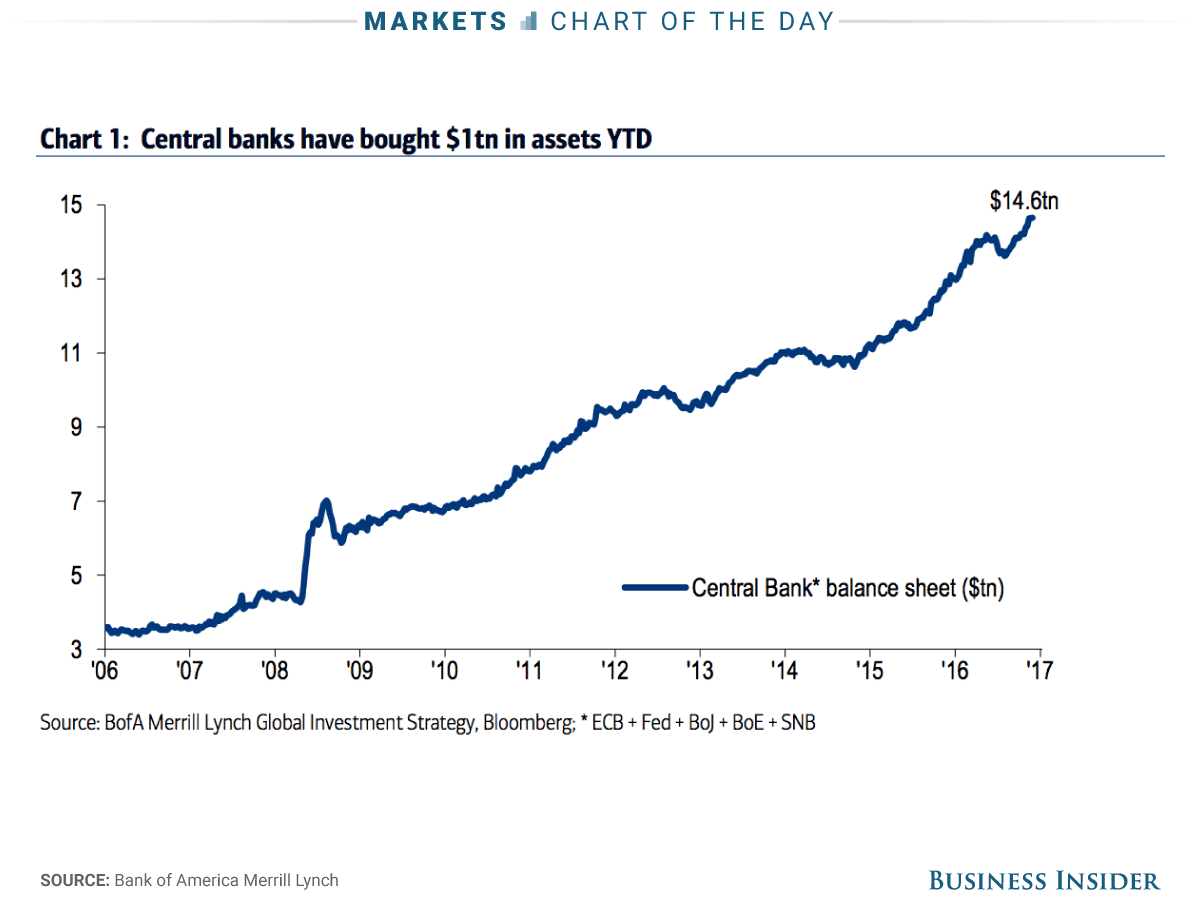
It would not surprise me to see the markets break out and attempt to push higher in the current environment. This is particularly the case as the confluence of Central Banks continue to buy assets, $1 Trillion since the beginning of the year, increased leverage and the embedded belief “There Is No Alternative (TINA).”
It would be quite naive to suggest otherwise.

The chart below is a Fibonacci retracement/extension chart of the S&P 500. I have projected both a 123.6% advance from the 2009 lows as well at a standard 50% retracement using historical weekly price movements.
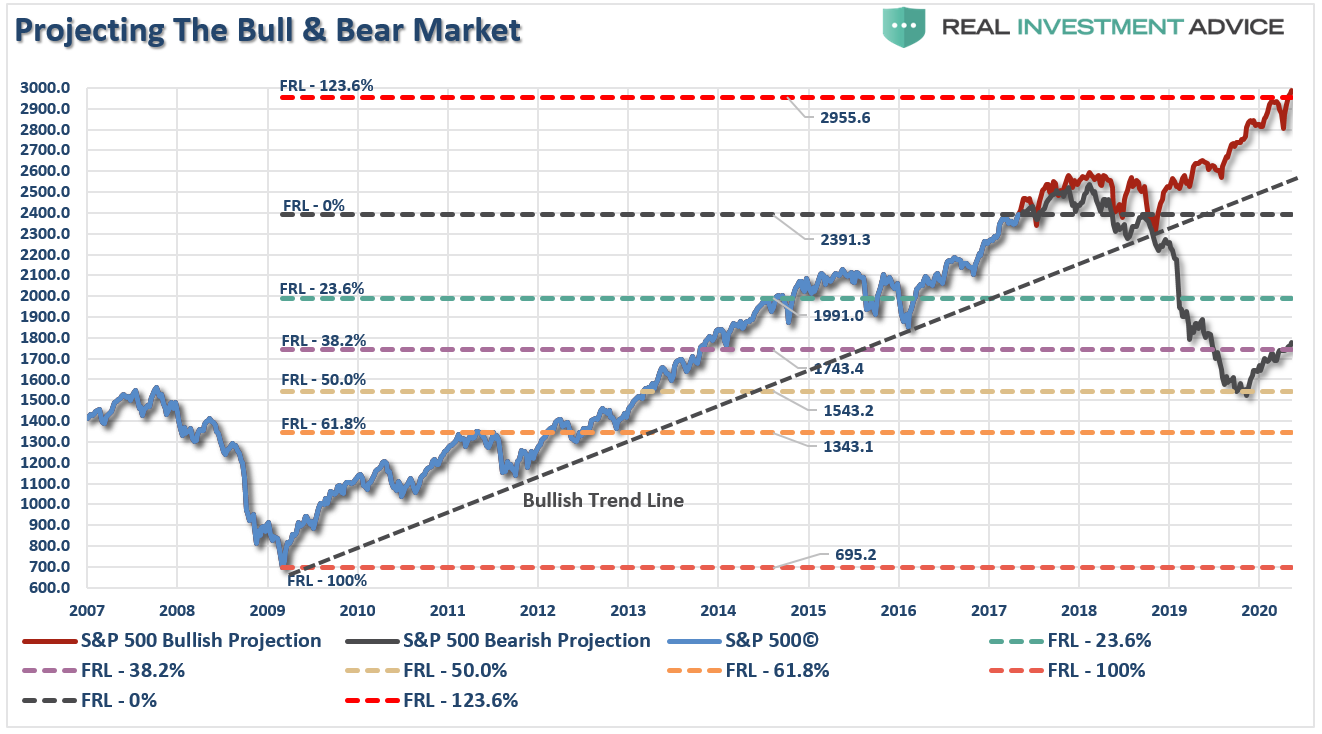
From the bullish perspective, a run to 3000, after a brief consolidation following an initial surge to 2500, is a distinct possibility. Such an advance is predicated on earnings and economic growth rates accelerating with tax cuts/reform being passed.
However, given the length of the economic and market cycle, there is a significant bear case being built which entails a pullback to 1543. Such a decline, while well within historical norms, would wipe out all gains going back to 2014.
Just for the mathematically challenged, this is NOT a good risk/reward ratio.
- 3000 – 2399 (as of Monday’s close) = 601 Points Of Potential Reward
- 2399 – 1543 = -856 Points Of Potential Loss
With a 1.3 to 1 risk/reward ratio, the potential for losses is far more damaging to your long-term investment goals than the gains available from here.
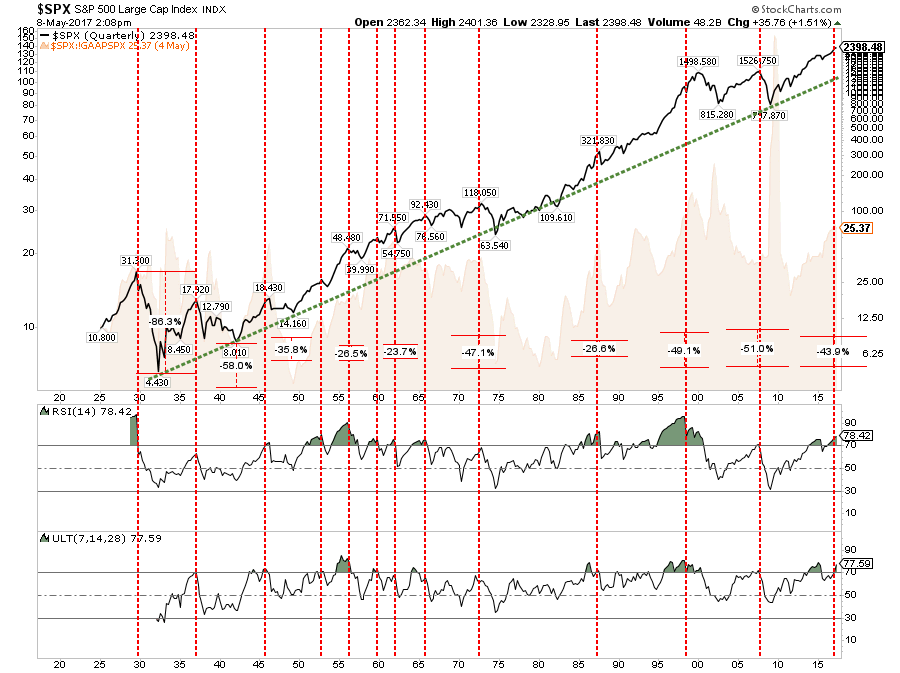
Moreover, the bearish case is also well supported by the technical dynamics of the market going back to the 1920’s, it would be equally naive to suggest that “This Time Is Different (TTID)” and this bull market has entered a new “bull phase.” (The red lines denote levels that have marked previous bull market peaks.)
Of course, as has always been the case, in the short-term it may seem like the current advance will never end.
It will.
And when it does the media will ask first “why no saw it coming.” Then they will ask “why YOU didn’t see it coming when it so obvious.”
In the end, being right or wrong has no effect on the media as they are not managing money nor or they held responsible for consistently poor advice. But, being right or wrong has a very big effect on you.
Yes, a breakout and a move higher is certainly viable in the current “riskless” environment that is believed to exist currently.
However, without a sharp improvement in the underlying fundamental and economic back drop the risk of failure is rising sharply. Unfortunately, there is little evidence of such a rapid improvement in the making. Either that, or a return to QE by the Fed which would be a likely accommodation to offset a recessionary onset.
In either case, it will likely be a one-way trip higher and it should be realized that such a move would be consistent with the final stages of a market melt-up.
Just as a reminder…“gravity is a bitch.”
Lance Roberts

Lance Roberts is a Chief Portfolio Strategist/Economist for Clarity Financial. He is also the host of “The Lance Roberts Show” and Chief Editor of the “Real Investment Advice” website and author of “Real Investment Daily” blog and “Real Investment Report“. Follow Lance on Facebook, Twitter and Linked-In