
by Blaine Rollins, CFA, 361 Capital
While there was plenty of ink spilled and electrons fired regarding the White House tax reform proposal last week, it could be a very long time before anything actually gets voted on. And who knows if it will even be passed. After looking over the budget that was passed by Congress over the weekend, I had to double check that the Republicans were still in the majority. From what I could tell, no spending was cut at all and programs were put on cruise control until the fall. It is prudent to read about all of the tax reform proposals that are being talked about, but I wouldn’t hold your breath until there is an actual vote on the floor containing items that will impact you and your clients.
Meanwhile, the U.S. markets were focused on better-than-expected corporate earnings last week. Google, Caterpillar, PayPal and several Healthcare names were top highlights, while the totals showed a solid percent of companies beating their bottom lines. So while the noise continues in Washington D.C., the bottom line results from the companies themselves sound better than we had thought they would be in this uncertain political environment. Combine this with the improved mood in Europe post the French elections, and continued world support to ease North Korea into submission and the markets had a good week.
Looking at the week, Europe and U.S. Technology led in equities, while Gold, the U.S. Dollar and Treasuries sold off…

Among U.S. equity sectors, Biotech, Healthcare, Technology and Consumer Discretionary led the charge for the week. Gold and REITs lagged.

As a result of this week’s sector leaders, growth continued to significantly outperform value…

(Goldman Sachs)
The Nasdaq 100 is not only notching all-time highs, but it is putting together consistent outperformance…

Fundstrat points out that the S&P 500’s top 10 are doing the heavy lifting over the last two months…
Over the last two months, the vast majority of the benchmark US stock index — some 490 stocks — are essentially flat, according to Fundstrat.
Apple, Facebook, Amazon, Alphabet, Microsoft, Visa, Philip Morris, Home Depot, Comcast and Oracle by contrast have done the heavy lifting, rising 18.4 per cent this year. Given the weighting of the companies in the index, they have been essential to producing gains over the last two months.

But Goldman points out that the market breadth is nowhere near where it was in past moves…

(@carlquintanilla)
Adding up the earnings beats shows this quarter looking at an 11-year high…

(@bespokeinvest)
Factset shows what sectors and names are pushing the beats…
What is driving the increase in the earnings growth rate since March 31? In aggregate, upside revisions to earnings estimates and upside earnings surprises reported by S&P 500 companies have led to an $8.5 billion increase in earnings for the index since March 31 (as higher actual earnings replace estimated earnings in the growth rate calculation). Five sectors account for $7.5 billion (or 88%) of this $8.5 billion increase in earnings since March 31: Industrials, Financials, Health Care, Information Technology, and Consumer Discretionary.
Of these five sectors, the Industrials and Financials sectors have been the largest contributors to the rise in earnings growth for the index since the end of the quarter. These two sectors account for $3.7 billion (or 44%) of the $8.5 billion increase in earnings for the S&P 500 since March 31. The upside earnings surprises reported by Bank of America ($0.41 vs. $0.35), JPMorgan Chase ($1.65 vs. $1.51), Caterpillar ($1.28 vs. $0.63), General Electric ($0.21 vs. $0.17), and Morgan Stanley ($1.07 vs. $0.89) were all substantial contributors to the increase in earnings growth for the index during this time.
(Factset)

Also important to monitor is that more companies are raising guidance rather than lowering it…

Of course not all was roses during last week’s earnings period…
If you want some thorns, look no further than U.S. consumer finance companies focused on credit cards and auto lending. These three companies all sorely disappointed their investors.
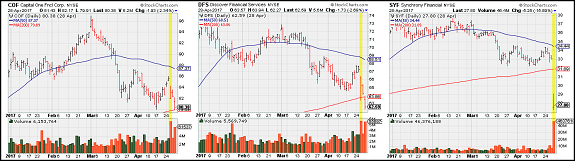
For Synchrony, bad credit card loans caught them by surprise…
Provisions for loan losses surged 21 percent to $1.3 billion compared with the prior quarter, the Stamford, Connecticut-based firm said Friday in a statement. That exceeded the $1 billion average estimate of analysts surveyed by Bloomberg. Synchrony’s write-off rate climbed to 5.03 percent, the highest since at least 2012, according to presentations posted on the firm’s website.
Capital One Financial Corp., Citigroup Inc. and Discover Financial Services also reported a jump in bad credit-card loans last quarter, drawing concern from analysts and investors about consumer credit quality. Federal Reserve data show revolving credit, primarily card balances, increased by $2.92 billion to $1 trillion in February, the highest level since the financial crisis.
Bad card loans also hit Capital One…
Chief Executive Richard Fairbank said the bank raised its outlook for full-year, domestic card charge-off rates to the high end of a 4%-to-around 5% range. That was up from the bank’s prior expectation of the mid-4% range. Mr. Fairbank said this revision is “based on portfolio dynamics and industry conditions [the bank] observed in the first quarter.”
Mr. Fairbank voiced concerns about growing consumer indebtedness, saying the first quarter marked the seventh consecutive one in which card loans industrywide are growing faster than household income.
“Against this backdrop, we have been tightening our underwriting,” he added. “We still see growth opportunities in our domestic card business, but our growth window is gradually getting smaller.”
In one other area of concern, auto-loan performance, Mr. Fairbank also struck a cautious note. Used-car values have been declining, based on some indexes, resulting in higher losses for some auto lenders.
(WSJ)
Meanwhile, a major auto lender is worried about the current supply of autos…
Ally Financial Inc. Chief Executive Officer Jeff Brown said he’s more concerned about bulging car-dealer lots than overdue auto loans.
“Inventory lots across the U.S. are very full,” Brown said Thursday in a phone interview after the lender reported first-quarter profit that matched estimates. “We’re watching how disciplined manufacturers are.”
Ally, which Bloomberg Intelligence estimates has 55 percent of its loan book in auto credit, is keeping its “eyes wide open” as U.S. auto sales slump and used-car prices drop, Brown told analysts on an earnings call Thursday. Ally scaled back 2017 earnings expectations last month amid a sharp decline in used-vehicle prices, which Brown expects to decline 6 to 7 percent this year, then another 6 to 7 percent the following two years.
Another sore spot was found at the airline stocks in the form of labor cost increases…
American Airlines fell the most in 10 months – dropping 8.6 per cent to a two-week low of $42.41 – after the company proposed giving its pilots and flight attendants an average pay bump of 8 per cent and 5 per cent respectively. The pay action was unexpected given that America’s current contracts with its pilots are not due for renewal until 2020 while those for its attendants don’t expire until 2019. Jamie Baker, an analyst at JPMorgan said the move could set “a worrying precedent…both for American and the industry.” The raises – which could go into effect as early as May if unions for both groups approve the deal – is expected to cost American $230m in 2017 and $350m in 2018 and 2019, the company said in a regulatory filing.
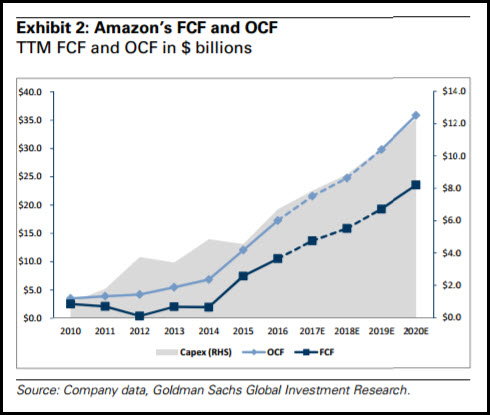
On the positive side of earnings, Amazon reported…
Earnings and cash flow continue up and to the right at an amazing rate.
Peak earnings are now behind us, but this week is still a sizable reporting week with about 20% of the market reporting…

(@eWhispers)
With April over, we always have a few seasonality charts to look at around the ‘Sell in May’ phenomenon…
@bespokeinvest: Here are returns over 50 years if you just held stocks ONLY from Nov to April vs. ONLY from May to Oct.

This is an interesting ETF chart…
It shows the average holding period for the underlying ETFs. You can quickly tell which ETFs are bought by retail customers and which are traded by institutional customers (SPY, QQQ, GLD).

(@MStarETFUS)
One more ETF chart…
This one shows cumulative flows. Looks like U.S. equity flows have taken a significant pause while the International equity flows continue up and to the right.

(Credit Suisse, WSJ/DailyShot)
Confirming the previous chart would be this one showing the outperformance of Europe over the U.S…
@WhatILearnedTW: Euro Stoxx 50 Index ETF, an index of leading eurozone equities, has registered a decisive breakout

This RenMac chart also confirms that investors are happy to own Emerging Market equities as their credit becomes less risky…

If you believe in the product line, put Weight Watchers on your radar screen…
Mindy Grossman is a very good operator. She helped Nike fix some problems in the early 2000’s and then made Barry Diller a fortune in Home Shopping Network.
Weight Watchers International Inc said Mindy Grossman, current chief executive of HSN Inc, will join the diet company as CEO in July, sending the company’s shares up nearly 13 percent in aftermarket trading on Wednesday.
Grossman, who has led HSN since 2008, will also join Weight Watchers’ board, the company said in a statement.
Grossman was named Fortune’s Business Person of the Year in 2014 and has been named one of the world’s 100 most powerful women three times by Forbes magazine, Weight Watchers said.
She has more than 38 years of experience in the consumer industry, including in executive roles at Nike Inc, Polo Jeans Company and Polo Ralph Lauren Corp.
(Reuters)
Prices and tariffs are increasing, so the value of your home is going up. Here is the non-labor cost breakdown…

(John Burns, WSJ/DailyShot)
And as storm damage hits hard this year, the costs could be even higher-than-expected if labor and non-labor costs are rising…
The insured damage from all natural disasters in the U.S. in the first quarter is currently estimated to total nearly $7 billion, according to reinsurance specialist Aon Benfield. Of that, about $6 billion is from severe storms.
That makes this year’s opening three months the most expensive first quarter on record for the insurance industry in paying out severe thunderstorm-related claims, the firm said. This year’s first-quarter cost compares with an average of about $1.5 billion in such first-quarter insured losses from 2000-2016, Aon Benfield said.
According to preliminary government data, there were 425 tornadoes from January through March, compared with 205 in the same period in 2016, and an average of 93 in the same period for the three years 2014-2016.
(WSJ)
Finally, farewell to a couple of flagship mutual funds…
On Friday, the Janus Fund and the Janus Twenty Fund struck their NAVs for the final time. As a result of the recent merger of the corporate parent, the 47 and 32-year-old Funds are being merged away into other funds. Thanks to the former Janus Fund portfolio managers: Barney, Jean, Jonathan, Dan, David, Jim and of course Tom who launched the Fund as a partnership back in the sixties. What an unforgettable run we had.
Copyright © 361 Capital