Margin Debt: Worry or Overblown Anxiety?

Margin Debt: Worry or Overblown Anxiety?

by Ryan Detrick, LPL Research

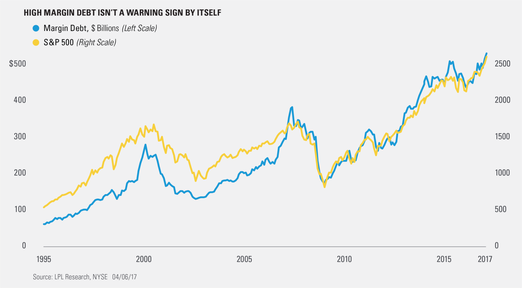
New York Stock Exchange (NYSE) margin debt is back in the news, as levels reached yet another new all-time high in February 2017 of $528 billion. Margin debt is viewed as a potential contrarian indicator; when margin debt is high, this suggests investors are potentially over-leveraged and therefore too bullish.Ā Per Ryan Detrick, Senior Market Strategist, ā€œMany have speculated for several years now that high margin debt would lead to lower equity prices, but it hasnā€™t yet proved to be a useful market signal. In fact, margin debt first broke out to new highs in April 2013, and weā€™ve been hearing since then that this is a potential warning sign. For those scoring at home, the S&P 500 Index has been up nearly 70% since then.ā€

The figure below shows margin debt as it relates to the S&P 500 Index. As you can see, the two are highly correlated and margin debt looks more coincident than leading. In other words, the two tend to move in the same direction at the same time, so margin debt levels have not been a good predictor of future movements in the index.

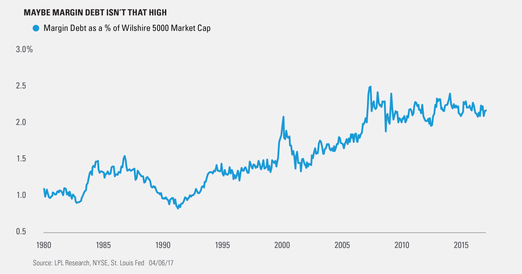
Viewing margin debt by itself isnā€™t telling the full picture, however. Yes, the total value of margin debt may be higher now than at the 2000 and 2007 peaks, but the entire stock marketā€™s value is also much higher.Ā To get a more apples-to-apples take on this, we use margin debt as a percentage of the Wilshire 5000 (market capitalization of the total U.S. stock market). This ratio currently sits at 2.2% versus the 2007 peak of nearly 2.5%. In fact, margin debt as a percentage of the overall stock market value has trended in a range over the last 10 years and currently sits near the midpoint of that range, which is not particularly worrisome at this point, in our view.

Last, weā€™ve seen many analyze margin debt as a percentage of the U.S. economy (gross domestic product [GDP]), but we donā€™t think this is relevant. The reality is that the U.S. has become much more productive and profitable for a given level of economic activity, and thus, using historical GDP data wonā€™t tell an accurate story.


IMPORTANT DISCLOSURES
Past performance is no guarantee of future results. All indexes are unmanaged and cannot be invested into directly.
The opinions voiced in this material are for general information only and are not intended to provide or be construed as providing specific investment advice or recommendations for any individual security.
The economic forecasts set forth in the presentation may not develop as predicted.
Investing in stock includes numerous specific risks including: the fluctuation of dividend, loss of principal and potential illiquidity of the investment in a falling market.
The use of leverage attempts to enhance investment returns by borrowing money, or through the use of other debt instruments, and can magnify both gains and losses, resulting in greater volatility.
Stock investing involves risk including loss of principal.
The Standard & Poorā€™s 500 Index is a capitalization-weighted index of 500 stocks designed to measure performance of the broad domestic economy through changes in the aggregate market value of 500 stocks representing all major industries.
The Wilshire 5000 Total Market Index (Wilshire 5000) measures the performance of all U.S. equity securities with readily available price data.Ā  Approximately 5,000 capitalization-weighted security returns are used to adjust the index.Ā  The Wilshire 5000 base is its December 31, 1980 capitalization of $1,404.596 billion.
This research material has been prepared by LPL Financial LLC.
To the extent you are receiving investment advice from a separately registered independent investment advisor, please note that LPL Financial LLC is not an affiliate of and makes no representation with respect to such entity.
Not FDIC/NCUA Insured | Not Bank/Credit Union Guaranteed | May Lose Value | Not Guaranteed by any Government Agency | Not a Bank/Credit Union Deposit
Securities and Advisory services offered through LPL Financial LLC, a Registered Investment Advisor Member FINRA/SIPC
Tracking # 1-597835 (Exp. 4/18)
Total
0
Shares
Previous Article

Is confidence in the US economy due to spontaneous optimism?

Next Article

Amid Global Uncertainty, Pay Attention to this Manufacturing Index

Related Posts
Subscribe to AdvisorAnalyst.com notifications
Watch. Listen. Read. Raise your average.