by Ryan Detrick, LPL Research
Emerging markets (EM) have finally come to life recently, after lagging the S&P 500 Index for nearly five years. Year to date, the MSCI Emerging Markets Index is up 12.7% versus the S&P 500’s 4.6% gain. Going out 12 months, it is 18.9% versus 15%, respectively. As we noted nearly a year ago in Emerging Market Earnings: Is The Tide Turning?, there were some indications that conditions were improving, and that has been the case. Now the question is: Can it continue?
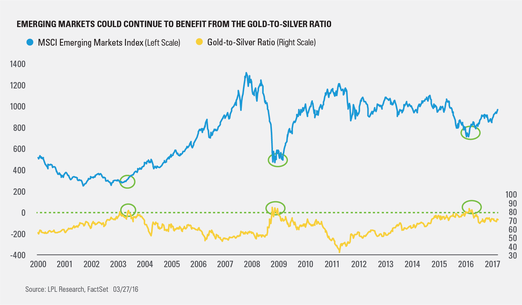
One of our favorite indicators for determining how well (or poorly) EM could do is the gold-to-silver ratio. This ratio measures the number of ounces of silver needed to buy a single ounce of gold. Silver is considered to be both a precious metal and an industrial metal, unlike gold. So as industrial metals have done well over the past year, silver has outperformed gold. As a result, the ratio has declined, and commodity-heavy EM countries have outperformed.
A year ago the ratio was above 80, which was the highest since late 2008 during the financial crisis. As we noted last April, the previous two times this ratio became that high were great buying opportunities for EM. Third time’s a charm, at least so far. The bottom line is, when silver outperforms gold (and this ratio declines), historically, EM has tended to benefit, as the updated chart shows.
What matters here and now is that although the ratio is lower than it was over a year ago, it still has plenty of room to move lower, which suggests outperformance in EM could potentially continue.
Per Ryan Detrick, Senior Market Strategist, “One of the key questions money managers are asking themselves is whether emerging markets (EM) can continue to outperform. We think they can given valuations are low, while consensus earnings are expected to be nearly twice that of the S&P 500 in 2017; and from a relative point of view, EM has recently started to outperform after years of underperformance. Remember, these trends in price momentum tend to last years, not months, which could bode well for EM strength to continue.”
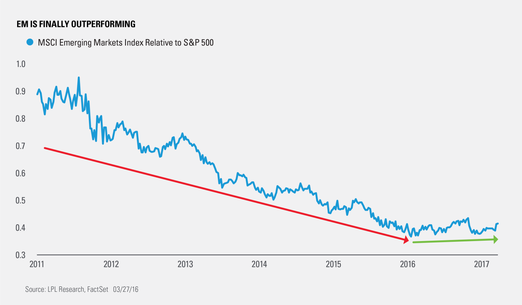
Last, EM performance relative to the S&P 500 has stopped declining. As this relative strength chart shows, after falling for nearly five years relative to the S&P 500, EM has stopped falling and has outperformed the S&P 500 over the past year. It might sound simple, but the first step to relative outperformance is to stop going lower, and that looks to be the case with EM.
IMPORTANT DISCLOSURES
Past performance is no guarantee of future results. All indexes are unmanaged and cannot be invested into directly.
The opinions voiced in this material are for general information only and are not intended to provide or be construed as providing specific investment advice or recommendations for any individual security.
The economic forecasts set forth in the presentation may not develop as predicted.
A commodity is a basic good used in commerce that is interchangeable with other commodities of the same type. Commodities are most often used as inputs in the production of other goods or services. The quality of a given commodity may differ slightly, but it is essentially uniform across producers.
Risks inherent to investments in stocks include the fluctuation of dividend, loss of principal, and potential liquidity of the investment in a falling market.
International and emerging markets investing involves special risks, such as currency fluctuation and political instability, and may not be suitable for all investors.
The S&P 500 Index is a capitalization-weighted index of 500 stocks designed to measure performance of the broad domestic economy through changes in the aggregate market value of 500 stocks representing all major industries.
The MSCI Emerging Markets Index is a free float-adjusted, market capitalization index that is designed to measure equity market performance of emerging markets.
This research material has been prepared by LPL Financial LLC.
To the extent you are receiving investment advice from a separately registered independent investment advisor, please note that LPL Financial LLC is not an affiliate of and makes no representation with respect to such entity.
Not FDIC/NCUA Insured | Not Bank/Credit Union Guaranteed | May Lose Value | Not Guaranteed by any Government Agency | Not a Bank/Credit Union Deposit
Securities and Advisory services offered through LPL Financial LLC, a Registered Investment Advisor Member FINRA/SIPC
Tracking # 1-594605 (Exp. 03/18)


