by Ryan Detrick, LPL Research
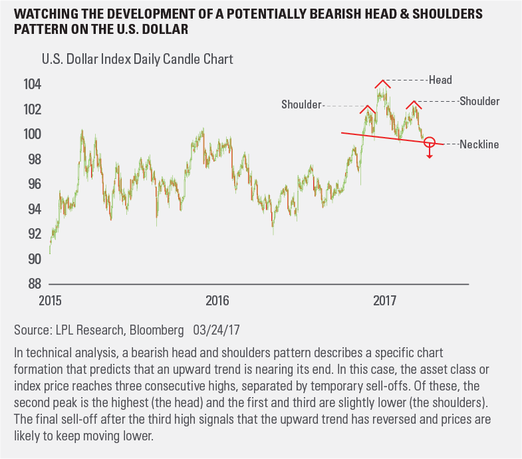
The U.S. Dollar Index daily price chart may be exhibiting warning signs of a potential rollover and move lower, as depicted by a bearish “head-and-shoulder” chart pattern formation.
Technical analysts note this type of topping, or trend reversal pattern, when a price chart forms three successive peaks—two shoulders and the head, which is the highest peak in the middle. The neckline, or trend line, connects the low points of the pattern together and acts as the last area of support for the price. If the price falls below the neckline, the expectation is the pattern will execute to the downside, and the price will continue to fall. The distance between the top of the head (or highest peak) and the neckline is used to determine the approximate distance of the move lower. Simply, the same distance is subtracted below the neckline in order to estimate the bearish head-and-shoulders downward price target.
The current pattern, which began in November 2016, has a neckline support level at 99.25. If the index price remains below this level for at least five trading days it will increase the likelihood that the pattern executes to the downside and the price moves lower over the next three to six months.
When the U.S. Dollar Index breaks the trend line and continues lower, there may be opportunities in asset classes that are inversely correlated to the currency such as precious metals and other commodities, which tend to benefit from a weaker U.S. dollar.
IMPORTANT DISCLOSURES
Past performance is no guarantee of future results. All indexes are unmanaged and cannot be invested into directly.
The opinions voiced in this material are for general information only and are not intended to provide or be construed as providing specific investment advice or recommendations for any individual security.
The economic forecasts set forth in the presentation may not develop as predicted.
Investing in stock includes numerous specific risks including: the fluctuation of dividend, loss of principal and potential illiquidity of the investment in a falling market.
Stock investing involves risk including loss of principal.
The U.S. Dollar Index indicates the general international value of the USD. The index is calculated by averaging the exchange rates between USD and major world currencies.
Technical Analysis is a methodology for evaluating securities based on statistics generated by market activity, such as past prices, volume and momentum, and is not intended to be used as the sole mechanism for trading decisions. Technical analysts do not attempt to measure a security’s intrinsic value, but instead use charts and other tools to identify patterns and trends. Technical analysis carries inherent risk, chief amongst which is that past performance is not indicative of future results. Technical Analysis should be used in conjunction with Fundamental Analysis within the decision making process and shall include but not be limited to the following considerations: investment thesis, suitability, expected time horizon, and operational factors, such as trading costs.
This research material has been prepared by LPL Financial LLC.
To the extent you are receiving investment advice from a separately registered independent investment advisor, please note that LPL Financial LLC is not an affiliate of and makes no representation with respect to such entity.
Not FDIC/NCUA Insured | Not Bank/Credit Union Guaranteed | May Lose Value | Not Guaranteed by any Government Agency | Not a Bank/Credit Union Deposit
Securities and Advisory services offered through LPL Financial LLC, a Registered Investment Advisor Member FINRA/SIPC
Tracking #1-594175 (Exp. 3/18)


