For this week’s edition of the Equity Leaders Weekly, we are going to re-examine the Gold Continuous Contract which we have not visited since the beginning of the 2017. With U.S. stocks witnessing the first 1 percent decline since October, 2016 on Tuesday, havens such as gold have benefited in price action.
Second we will look the US Dollar Index Continuous Contract. With the Federal reserve raising rates on Wednesday March 15 for the second time in 3 months, the dollar fell, it will be interesting to see what the Fed does through the rest of 2017 and the effect this has on the dollar and Gold prices moving through the rest of the year.
Gold Continuous Contract (GC.F)
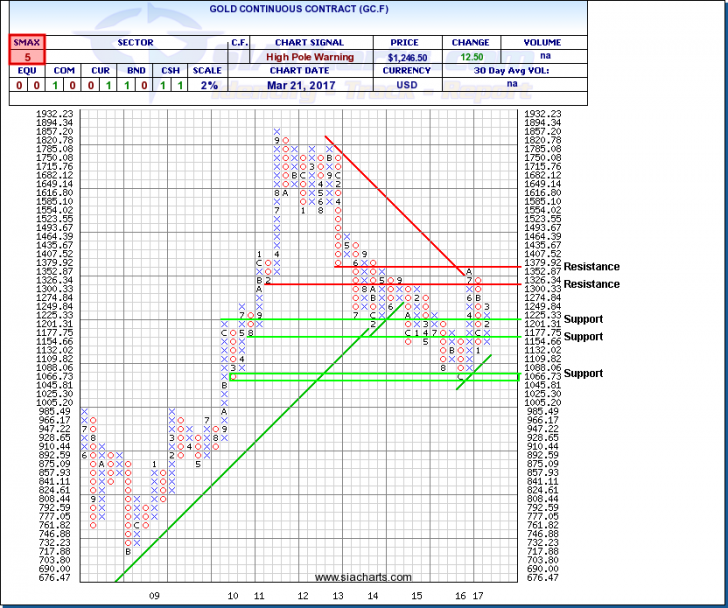
Gold prices are currently on a 6-day winning streak and this appears to have been spurred on as concerns deepen among investors that Donald Trump will not be able to deliver on pro-growth promises for the U.S. economy. Even as U.S. stocks rebounded Wednesday, safe havens like Gold continued to remain in demand. An eye should be kept on the U.S Federal Reserve as Janet Yellen’s appearance on March 23rd is sure to attract the most attention. Gold traders will be watching this closely, as we remain on the longest run up since the U.K. vote to leave the European Union.
Looking at the chart, we are once again approaching a level that could continue with the break in the multi-year downtrend breached in the middle of 2016. Although weakness set in shortly after breaking this downtrend, Gold prices have gained momentum, specifically in the most recent trading days. Watch for support right around $1,200 and $1,150, then next at the important psychological level of $1,000. To the upside, watch for resistance to play a role around $1,325 and then again around $1,380. Although Gold remains with a negative SMAX of 5, it has improved since the beginning of the year.
Click on Image to Enlarge

US Dollar Index Continuous Contract (DX2.F)
The US Dollar Index is a broad measure of the value of the United States dollar relative to a basket of foreign currencies. This basket includes the following currencies: Euro (58%), Japanese yen (14%), Pound Sterling (12%), Canadian dollar (9%), Swedish krona (4.2%), and Swiss franc (3.6%).
On Wednesday we started to see hopes that the Federal Reserve will increase interest rates more than previously forecast in 2017 begin to fade, and a slight weakening of the dollar, as opposed to strengthening as one would expect with the recent rate increase. With the Fed indicating that only two further adjustments would be in order for 2017, and investors awaiting news from US President Donald Trump on his pro growth policies, the dollar may have more headwinds than expected in a rising rate environment. This would continue to be positive for the movement upwards of Gold prices.
Turning to the Chart of DX2.F, we can see that it has maintained its positioning moving up a little since we last looked at this chart. A very important support level comes in at $100.47, and investors will be watching this closely if it is broken. Our next level of support comes in at $97.51 and then again around $92. To the upside resistance can be found at $105.59 and then up through $110. With an SMAX of 8 out of 10, the US Dollar Index is continuing to show near-term strength against the asset classes.
Click on Image to Enlarge

SIACharts.com specifically represents that it does not give investment advice or advocate the purchase or sale of any security or investment. None of the information contained in this website or document constitutes an offer to sell or the solicitation of an offer to buy any security or other investment or an offer to provide investment services of any kind. Neither SIACharts.com (FundCharts Inc.) nor its third party content providers shall be liable for any errors, inaccuracies or delays in content, or for any actions taken in reliance thereon.
For a more in-depth analysis on the relative strength of the equity markets, bonds, commodities, currencies, etc. or for more information on SIACharts.com, you can contact our sales and customer support at 1-877-668-1332 or at siateam@siacharts.com.
Copyright © SIACharts.com


