Market Evolution
by Craig Basinger, CFA, Richardson GMP
Change is inevitable, change is constant – Benjamin Disraeli
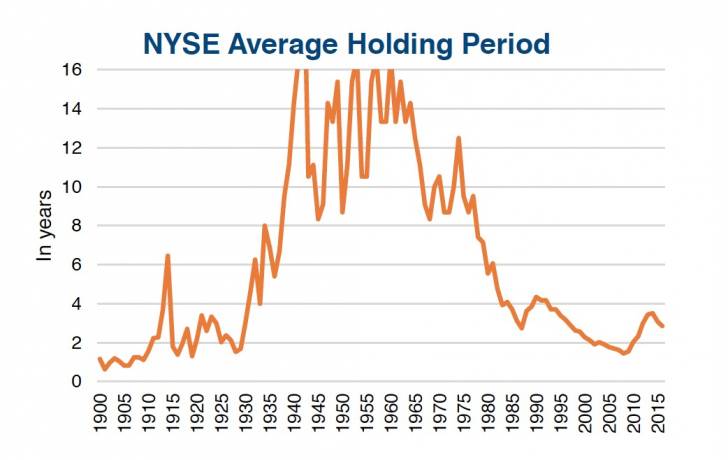
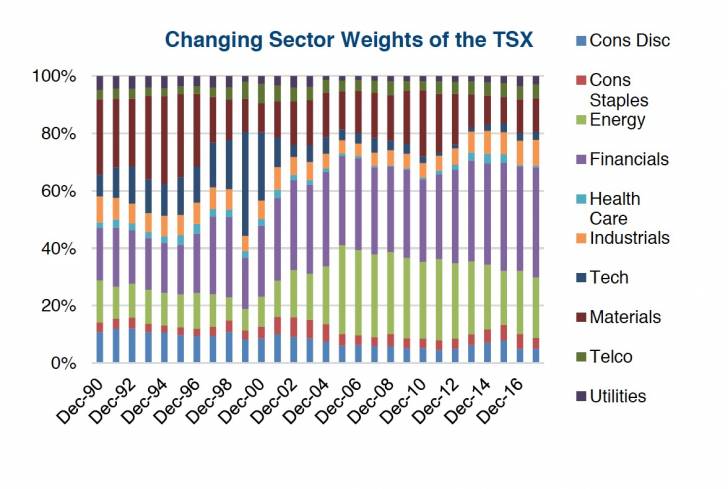
There was a time when the average holding period for a stock trading on the NYSE was over 10 years. Today it is under three years (chart). In the early 1990s, Financials comprised a mere 15% of the TSX and Gold stocks almost had the same weight at 12%. Today, Financials represent 36% and Gold a mere 6%. The Dow Jones Industrial Average, perhaps one of the most stable indices, has seen half its members removed over the past 20 years and replaced with new constituents. I still miss Bethlehem Steel. Today with names like Procter & Gamble, McDonalds, Cisco and Verizon, which names will not be there 20 years from now?
As portfolio managers, asset allocators, stewards of wealth and investors, it is a useful exercise to take a step back and look at the big picture. It is in this ever evolving environment that we practice our craft, trying to understand the change and the implications that will have on how we invest, is simply prudent.
In this edition of Market Ethos, we will share some of our research on the evolution of markets, what is driving the change and our thoughts on investment implications. Here goes.
Participants
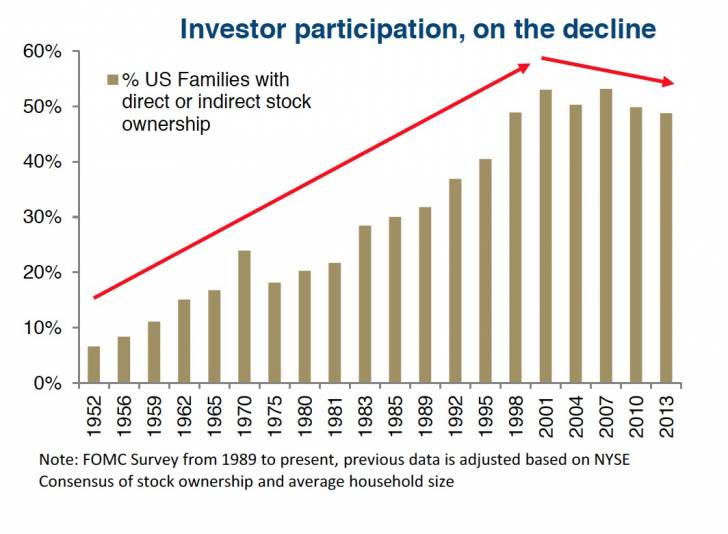
Whenever you buy an investment, invariably there is someone on the other side selling it to you (and vice versa). Who are they, why are they selling when you are buying, what do they know, are they the same participants as a few decades ago? As markets have evolved, so have the participants. In 1952, 7% of households owned equities either directly or indirectly. Back then, the market was dominated by a few large investors. Participation peaked in 2001 and has been declining gradually since then (chart). The 2016 survey will be available later this year to see if the trend continued. Perhaps 2001 was a frothy top due to the tech bubble. Regardless, a steady wave of new investors coming into the market that persisted during the 2nd half of the 20th century appears to have ended. We believe rising participation helped markets providing a steady stream of new buyers. Yet, while the participation rate may be shrinking, the wealth of investors has continue to rise from a dollar perspective. This is likely a contributor to the widening wealth gap prevalent in so many developed economies.
Other changes over time have been the size and number of sovereign wealth funds and endowment funds. Once a smaller part of the investor base, these pools have risen substantially over time.
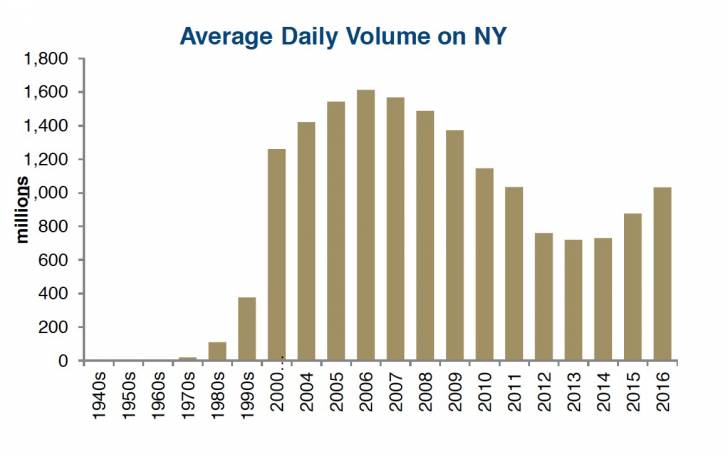
High Frequency Trading (HFT) now accounts for a large portion of daily trading activity. At its peak in 2006, it was estimated to account for over 70% of trading. HFT are various computer driven trading strategies, or algos, designed usually to take advantage of market or structural inefficiencies. As these strategies gained in profitability during the early 2000s, more and more capital was dedicated to these programs. Following the financial crisis with hurdles put in place to limit banks from proprietary trading, HFT went on the decline. This can be seen in the average daily volume on NYSE chart. We believe the recent rise in trading volumes are more attributable to the rise of ETFs.
Hedge Funds have risen in popularity, covering a wide array of trading strategies. While they most likely don’t have a specific impact on how markets trade, we would hazard a guess that the growth of hedge fund assets has fed market volatility. Many strategies place big one way bets on parts of the market. The fact that today there is a record amount of speculative open options and futures contracts representing a billion barrels of oil is a great example. If they begin to unwind, and they would do it quickly, the oil market would be hit hard.
Investor Behavior
Markets may change and evolve but one constant is we are all getting older. Given where the wealth sits, it is a safe bet the dollar weighted average investor has been getting older as well. This demographic shift has certainly contributed to rising demand for cash flow and rising demand for defense or less risk. This slow moving demographic trend will continue for a considerable amount of time as the baby boomer cohort continues to increase as a percentage of the overall population. Remember, it isn’t just the size of the age group but how much assets they control. Millennials are bigger but have limited assets at this point of their lives. That will change as wealth is passed down and the income of younger generations starts to ramp, not likely anytime soon.
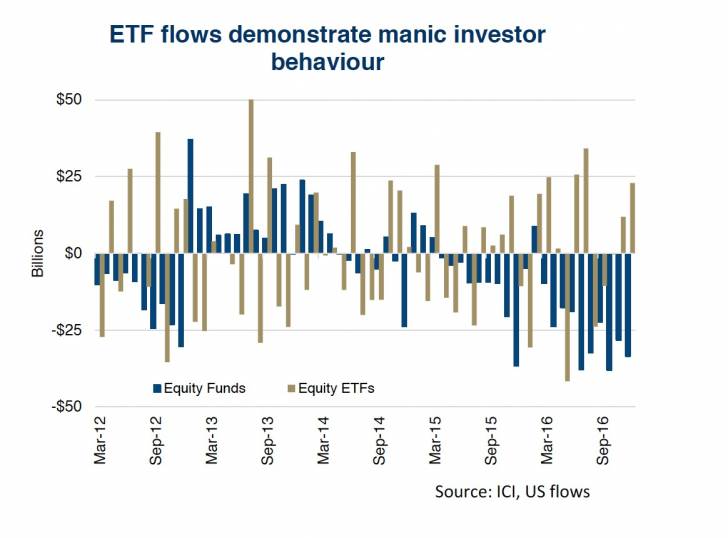
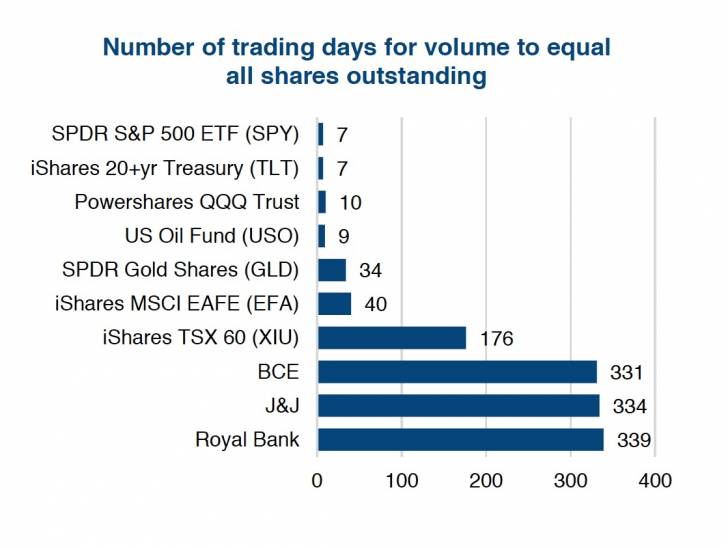
On page 1 we shared an average holding period chart demonstrating investor shorter time horizons these days. The rise of ETFs has contributed to this. The 2nd chart on this page is the monthly flows in and out of equity ETFs and equity mutual funds. Mutual fund flows tend to follow a cycle with multiple inflow months and multiple outflow months. ETFs on the other hand see massive inflows one month and massive outflows the next. While hard to generalize, a number of ETF investors clearly are more speculators than investors. This is evident in the 3rd chart as well, which measures the number of days it takes to turn over the total number of shares outstanding. Some ETFs are seeing volumes that equal the equivalent of all their shares outstanding changing hands every couple weeks. Compare that to regular equities such as Johnson & Johnson or Royal Bank, which take over a year of trading days.
Many ETF investors may be there for the long term but many are also there to hedge, bet or speculate. As an example, a couple decades ago if you wanted to invest in a given industry, you would research the companies in the industry and select a few for addition to your portfolio. Today, if you want to gain exposure to an industry, say cyber security, instead of picking between Palo Alto, FireEye, Splunk and Symantec, you can just buy the HACK ETF. The problem is with less due diligence and research, you may be more susceptible to bailing if it drops a bit or taking profits too early. This behaviour is speculating more than investing.
Technology & Market Structure
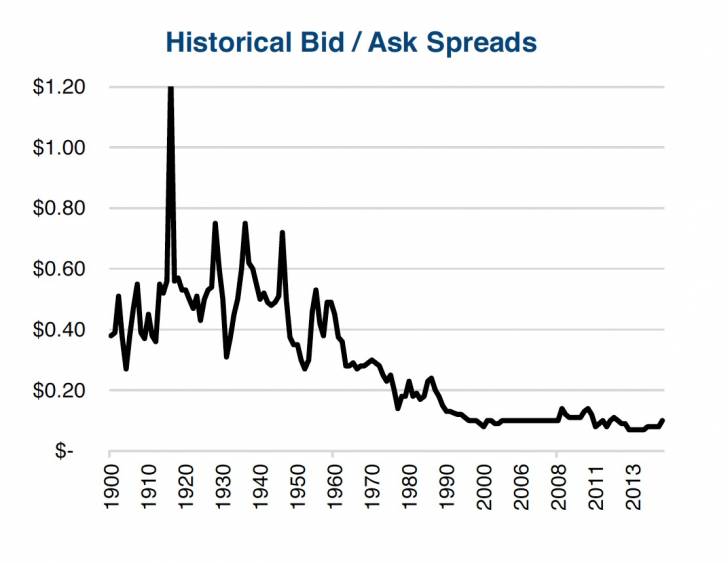
Technology has changed how the market trades. Now just about anyone can create an algorithm and use it in the market. One reason is obviously the rise of computers but also the reduction in transaction costs. The cost of trading is extremely low today compared to decades ago which encourages more trading or at least the ability to implement strategies that have a higher turnover. With commissions approaching zero at the institutional level, the real cost becomes market impact. Part of that is market depth but the other part can be measured in the bid/ask spread. A few decades ago when bid/ask spreads were $0.30, it was another tax on trading. Today, below $0.10, the tax is much less.
Earlier we discussed the changing sector weights in the markets. The 2nd chart on this page shows the TSX sector weights over the past 25 years and how they have changed. These changes are significant, Technology went from 40% in 1999 to 2% today. The more important question is where will it be ten years from now and should that impact your strategy? We think so.
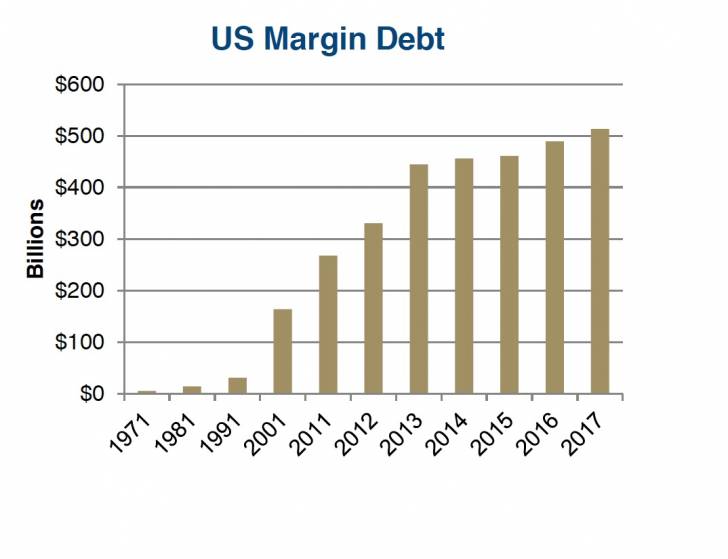
The third chart is margin debt. High margin debt is understandable given very low interest rates and rising equity prices. The reversal of either of those can trigger a cascading impact on market prices as margins are called in. We saw brief examples of that in the summer of 2015 and early 2016. It is now structural and it will, at some point, increase the speed and severity of a market decline.
Investment Implications
We believe, at the very least, investors should be cognizant of these ever changing factors affecting the markets. Given how the market has evolved we believe many of these, not all, but many contribute to faster moves in the market in one direction or another. They also help drive sudden changes in market direction. With the abrupt changes in direction and sizes of ETF flows and the amount of capital hedge funds throw at one- way bets in various markets, there is more fast money coming in and sometimes going out than ever before. Add to this interest rates, which have largely just gone down for a decade starting to go higher, plus record margin debt, big market swings are likely the norm going forward. In our opinion, this increases the need for volatility reduction strategies in investment portfolios
If you can think of other factors contributing to market evolution, feel free to contact any member of the Connected Wealth team. We would welcome the feedback and could include it in our ongoing research of market evolution.
*****
Charts are sourced to Bloomberg unless otherwise noted.
This material is provided for general information and is not to be construed as an offer or solicitation for the sale or purchase of securities mentioned herein. Past performance may not be repeated. Every effort has been made to compile this material from reliable sources however no warranty can be made as to its accuracy or completeness. Before acting on any of the above, please seek individual financial advice based on your personal circumstances. However, neither the author nor Richardson GMP Limited makes any representation or warranty, expressed or implied, in respect thereof, or takes any responsibility for any errors or omissions which may be contained herein or accepts any liability whatsoever for any loss arising from any use or reliance on this report or its contents. Richardson GMP Limited is a member of Canadian Investor Protection Fund. Richardson is a trade-mark of James Richardson & Sons, Limited. GMP is a registered trade-mark of GMP Securities L.P. Both used under license by Richardson GMP Limited.
Copyright © Richardson GMP


