by Ryan Detrick, LPL Research
It has been a great start to 2017, with the S&P 500 up nearly 6% year to date and both January and February higher. As we detailed last month, when January has been higher the rest of the year (so the next 11 months) has been higher 88% of the time. Now with February officially in the books, we’ll take a look at what it means when a new year starts off with both months higher.
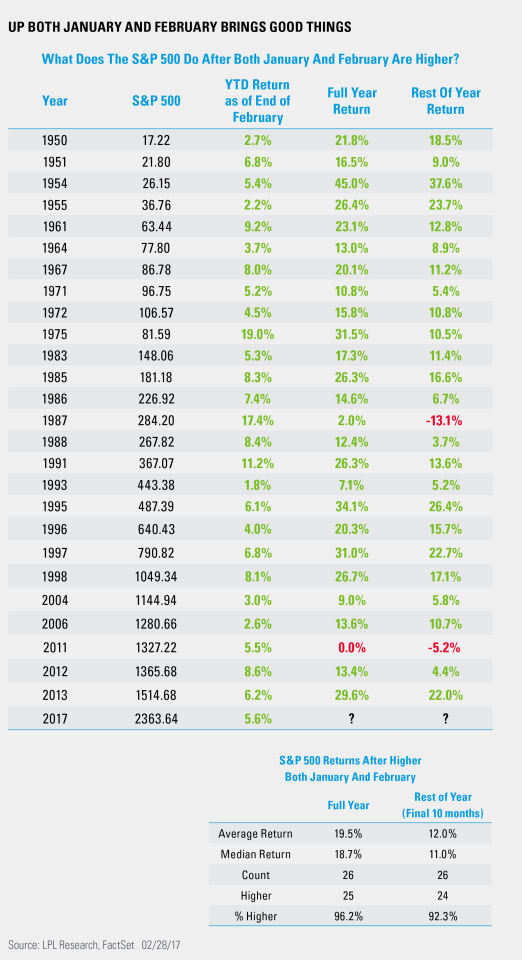
For starters, since 1950,* the S&P 500 was higher the first two months of the year 26 other times. The rest of the year (so next 10 months) was higher 24 of those times, and the entire year was up 25 times. In fact, the only full year that was “down” was 2011, but just by 0.0025%. On a total return basis though it was higher, so one could argue that since 1950, the full year has never been lower on a total return basis when the first two months have been higher. In fact, the average year has been up 19.5% for the full year when the first two months have been higher. Bodes well for 2017 to not spiral out of control and turn into a bear markets, doesn’t it?
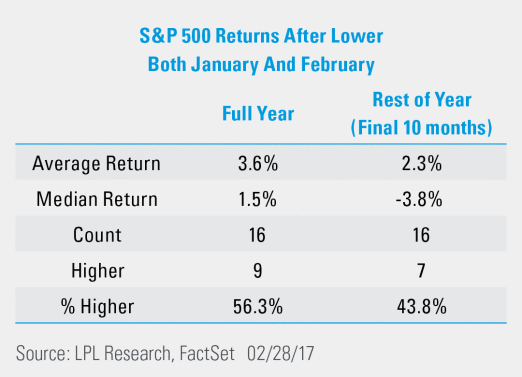
Here’s the catch: Momentum works both ways, as when the first two months have been lower, the rest of the year (so the final 10 months) has been up only 2.3% on average (with a median drop of 3.8%) and higher only 43.8% of the time.
Per Ryan Detrick, Senior Market Strategist, “It is clear that a good start to the year tends to set the tone for the rest of the year. Of course, this won’t always work, but what does appear to happen most of the time is when the S&P 500 has been higher in both January and February, market strength for the rest of the year has been perfectly normal. Even more important though is that a major bear market taking place later in 2017 (after the early year strength) would be very rare.”
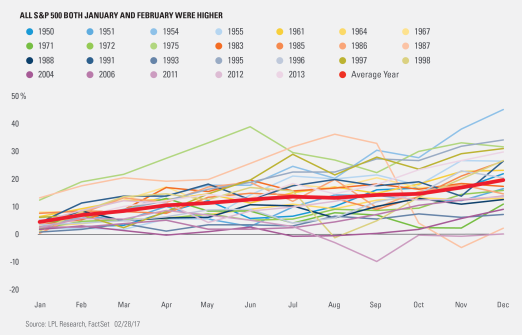
Last, here’s a nice chart of all 26 times when the S&P 500 was higher in January and February. The bottom line is it would be rare for the S&P 500 to see a significant pullback or even trade negative year to date from here on out. We aren’t saying it can’t happen, but history would suggest that would be rare.
IMPORTANT DISCLOSURES
*Please note: The modern design of the S&P 500 stock index was first launched in 1957. Performance back to 1950 incorporates the performance of predecessor index, the S&P 90.
Past performance is no guarantee of future results. All indexes are unmanaged and cannot be invested into directly.
The opinions voiced in this material are for general information only and are not intended to provide or be construed as providing specific investment advice or recommendations for any individual security.
The economic forecasts set forth in the presentation may not develop as predicted.
Investing in stock includes numerous specific risks including: the fluctuation of dividend, loss of principal and potential illiquidity of the investment in a falling market.
The S&P 500 Index is a capitalization-weighted index of 500 stocks designed to measure performance of the broad domestic economy through changes in the aggregate market value of 500 stocks representing all major industries.
This research material has been prepared by LPL Financial LLC.
To the extent you are receiving investment advice from a separately registered independent investment advisor, please note that LPL Financial LLC is not an affiliate of and makes no representation with respect to such entity.
Not FDIC/NCUA Insured | Not Bank/Credit Union Guaranteed | May Lose Value | Not Guaranteed by any Government Agency | Not a Bank/Credit Union Deposit
Securities and Advisory services offered through LPL Financial LLC, a Registered Investment Advisor Member FINRA/SIPC
Tracking # 1-586382 (Exp. 3/18)
Copyright © LPL Research


