by Burt White, CIO, LPL Financial
Analyzing real estate is all about the cycles. Evaluating real estate investments, including real estate investment trusts (REIT), depends on evaluating three cycles: the economic cycle (primarily jobs), the building cycle, and the interest rate cycle.
We believe we are in a good spot in the economic cycle for attractive U.S. real estate returns, with steady job gains and an improving domestic economic growth outlook. The building cycle for real estate shows little sign of the type of overbuilding that has ended previous cycles. Finally, although we expect interest rates to rise, we expect increases to be modest, and for the increases to be driven by improving economic growth and a gradual pickup in inflation, conditions historically favorable for real estate stocks.
Based on these metrics, our real estate outlook is favorable, especially for income investors in the case of REITs. Below we discuss these cycles and what they mean for publicly-traded real estate in 2017.
cycle #1: Economic cycle
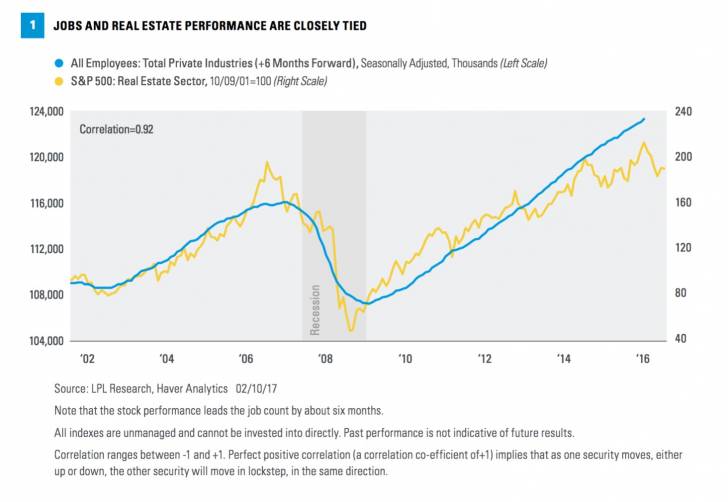
We believe real estate is well positioned for this stage of the economic cycle. Job growth has been steady, with an average of 195,000 jobs created monthly over the past 12 months. Jobs put workers in offices. Jobs give workers the wages to shop in the malls (or online, creating demand for warehouse space). Jobs enable workers to pay higher rents for their houses and apartments. And jobs help create inflationary pressure that gives real estate owners the pricing power to raise rents. All of these factors tie real estate to employment. This close relationship is evidenced by the 0.9 correlation between real estate stocks and total private employment [Figure 1], highest among the 11 S&P 500 sectors. Note that the stock performance leads the job count by about six months.

So where do we go from here? We have indicated that we expect job growth to slow in 2017, but several factors suggest the potential for continued solid gains and support for real estate investments. Fiscal stimulus from tax reform, infrastructure spending, and deregulation could help stimulate job growth, although the help may not come until late in the year. Consumer and business confidence are high, which tends to result in additional hiring. The employment component of the Institute for Supply Management’s manufacturing index is strong, having increased five straight months to 56.1 (50 is the breakpoint between expansion and contraction). All in all, the job picture looks good, although some slowdown in the 2016 pace would not surprise us, especially considering the economic expansion is nearly eight years old and unemployment is near its expected long-term rate.
Other cycle gauges we watch include the yield curve (the difference between short-term and long-term interest rates) and the index of leading indicators (LEI). These indicators, among others, suggest the cycle has a ways to go and further gains for real estate may lie ahead. And don’t forget interest rates are still low and the Federal Reserve (Fed) has only hiked rates twice, suggesting the economic cycle has a good amount left in the tank.
cycle #2: Building cycle
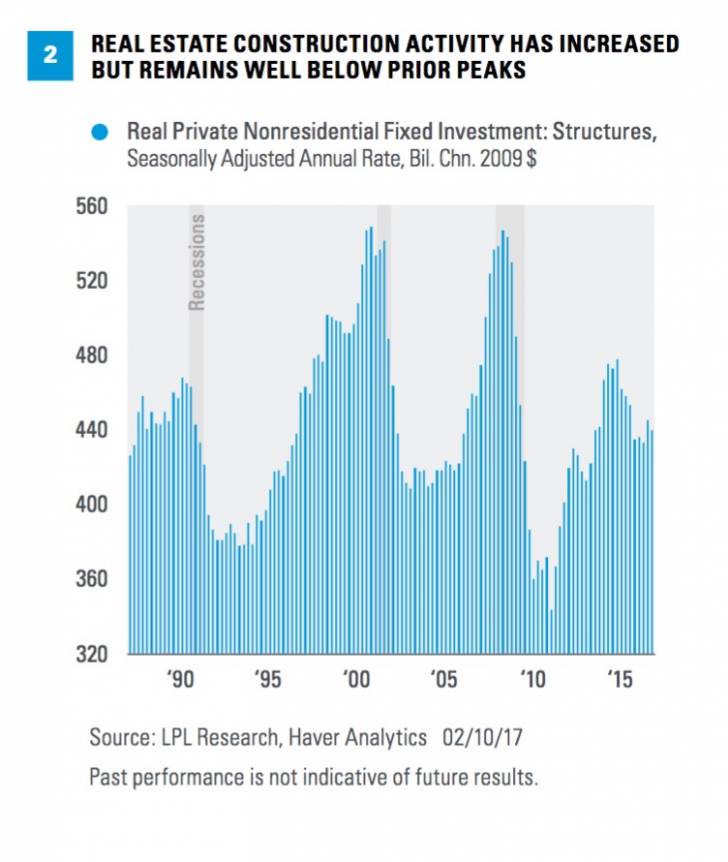
When assessing the building cycle, the key question to ask is whether the real estate industry is overbuilding. One consequence of the 2008-2009 financial crisis was that the supply of real estate was significantly constrained by the severity of the recession and reduced credit availability. The slower pace of building leaves the commercial real estate market in better supply-demand balance today than it has been at this stage of prior cycles. Case in point, the level of commercial construction in the latest gross domestic product (GDP) data, at $440 billion, is still only about halfway to the 2000 and 2007 peaks despite the $100 billion increase since the post-crisis trough in early 2011 [Figure 2]. Not only that but the pace of construction has pulled back since 2014, further evidence of the lack of froth.

Our proprietary LPL Research “Over Index” (a component of the Recession Watch Dashboard) also sheds light on the question of whether the real estate industry is overbuilding. This index has three components: overspending, overconfidence, and overborrowing. Scaled to 100%, the overborrowing measure—based on both consumer and business debt — is at just 32% (based on available data as of January 6, 2017), indicative of a disciplined market. The other two components are both at 40% or lower.
We do not see evidence of excessive froth in real estate lending markets. The latest Fed loan officer survey showed more tightening of commercial real estate lending standards than easing, although the survey showed less tightening over the past two quarters. Depending on the path of bank regulation, we could see further easing, but the key here is these data reflect discipline. The latest survey conducted by the Real Estate Roundtable indicated that those expecting tighter commercial real estate financing conditions are equal to those expecting easier conditions, and the ratio has been improving over the past several quarters. Finally, commercial real estate loan delinquency data indicates a healthy market, with a delinquency rate of 0.87%, below the troughs of the 1990s and 2000s. A healthy market coupled with disciplined lending practices is a good combination. Overall, we see good balance in the commercial real estate markets.
CYCLE #3: Interest rate cycle
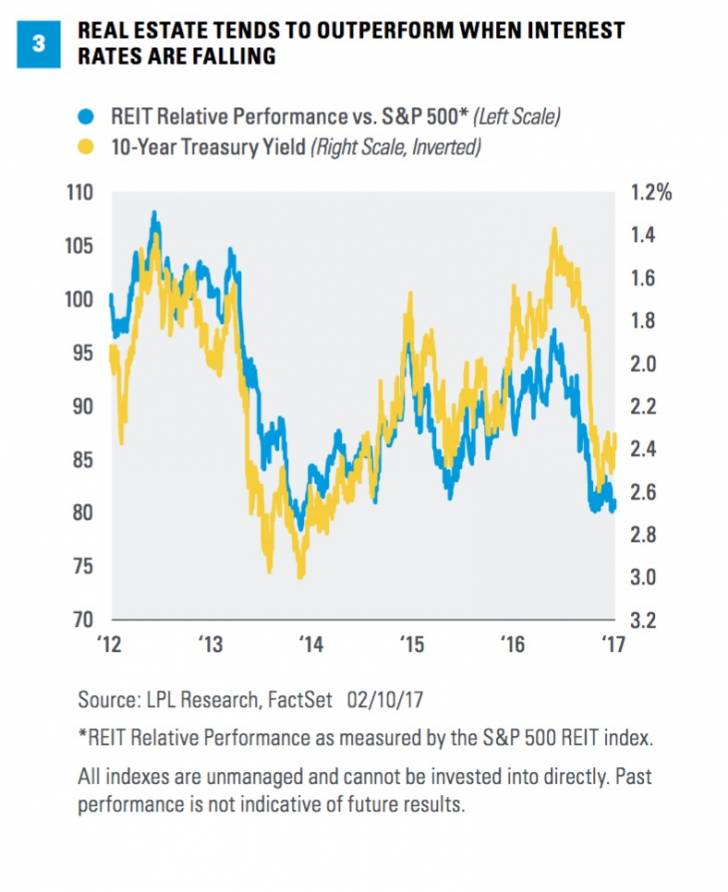
Rising interest rates are one of our biggest concerns when considering real estate. Higher interest rates reduce the attractiveness of potential distributions offered by REITs, and they increase borrowing costs for developers. As a result, real estate securities tend to underperform the broad equity market when interest rates rise. This relationship is shown in Figure 3, which presents the relative performance of real estate (compared with the S&P 500) plotted against the inverse of the 10-year Treasury yield. This relationship does not always hold, but certainly has over the past five years.

Higher interest rates are not all bad news. The interest rate cycle is tied to inflation, an important component of real estate values. Real estate owners often have the ability to raise rents in an inflationary environment and preserve or enhance the value of their assets. Higher rents support REIT dividend growth, which has historically exceeded the rate of inflation. In fact, the income component of REIT returns has exceeded inflation, based on the Consumer Price Index (CPI), in 15 out of the past 16 years based on S&P Dow Jones Indices data.
We expect interest rates to rise gradually over the course of 2017 and into 2018, presenting a headwind for real estate relative performance. However, should equity market returns in 2017 be modest as we expect, real estate — especially REITs — may have the potential to deliver an above-market total return.
Other considerations
We believe the aforementioned cycles inform the majority of the decision regarding investing in real estate, but here are a few other things to consider:
Cyclical vs. defensive sectors. We expect the macroeconomic environment to favor cyclical sectors, a potential headwind to real estate relative performance. Cyclical sectors are more economically sensitive, while defensive sectors are less sensitive to changes in economic conditions.
Valuations are slightly rich. Although the market values for publicly-traded real estate are slightly below net asset values (the actual values of the underlying properties), valuations based on cash flows are above average and cause for some concern. Cash flow growth is expected to be modest and may not support valuations.
Tax reform uncertainty is high. While some form of tax reform is very likely and should help the economic backdrop, some measures under discussion may have a negative impact on real estate, in particular the possible elimination of the deductibility of interest on debt. A border adjustment tax as part of tax reform may also increase the cost of construction. The timing and nature of tax reform remain a source of uncertainty for real estate.
Stand-alone sector lift? Being split out of financials into its own S&P sector may still lead to greater interest among generalist investors (discussed here). Generalists remain underweight the sector.
Conclusion
Evaluating domestic real estate depends on evaluating three cycles: the economic cycle, the building cycle, and the interest rate cycle. We believe we are in a good spot in the economic cycle; the real estate building cycle shows little sign of overbuilding that has ended previous cycles; and although we expect interest rates to rise, we expect increases to be modest and for the increases to be driven by improving economic growth and a gradual pickup in inflation, conditions historically favorable for real estate stocks.* It’s not all clear skies, but we believe the outlook for real estate in 2017 is favorable.
*We expect mid-single-digit returns for the S&P 500 in 2017 consistent with historical mid-to-late economic cycle performance. We expect S&P 500 gains to be driven by: 1) a pickup in U.S. economic growth partially due to fiscal stimulus; 2) mid- to high-single-digit earnings gains as corporate America emerges from its year-long earnings recession; 3) an expansion in bank lending; and 4) a stable price-to-earnings ratio (PE) of 18 – 19.
IMPORTANT DISCLOSURES
The opinions voiced in this material are for general information only and are not intended to provide specific advice or recommendations for any individual. To determine which investment(s) may be appropriate for you, consult your financial advisor prior to investing. All performance referenced is historical and is no guarantee of future results.
The economic forecasts set forth in the presentation may not develop as predicted and there can be no guarantee that strategies promoted will be successful.
Investing in stock includes numerous specific risks including: the fluctuation of dividend, loss of principal, and potential liquidity of the investment in a falling market.
Because of its narrow focus, specialty sector investing, such as healthcare, financials, or energy, will be subject to greater volatility than investing more broadly across many sectors and companies.
Alternative strategies may not be suitable for all investors and should be considered as an investment for the risk capital portion of the investor's portfolio. The strategies employed in the management of alternative investments may accelerate the velocity of potential losses.
Investing in real estate/REITs involves special risks such as potential illiquidity and may not be suitable for all investors. There is no assurance that the investment objectives of this program will be attained. REITs are linked to the commercial real estate market which can be volatile due to adverse macro-economic changes and their impact on property values , tenant defaults, and occupancy rates among other things.
Government bonds and Treasury bills are guaranteed by the U.S. government as to the timely payment of principal and interest and, if held to maturity, offer a fixed rate of return and fixed principal value. However, the value of fund shares is not guaranteed and will fluctuate.
Yield spread/differential is the difference between yields on differing debt instruments, calculated by deducting the yield of one instrument from another. The higher the yield spread, the greater the difference between the yields offered by each instrument. The spread can be measured between debt instruments of differing maturities, credit ratings, and risk.
INDEX DESCRIPTIONS
The Standard & Poor’s 500 Index is a capitalization-weighted index of 500 stocks designed to measure performance of the broad domestic economy through changes in the aggregate market value of 500 stocks representing all major industries.
The Institute for Supply Management (ISM) Index is based on surveys of more than 300 manufacturing firms by the Institute of Supply Management. The ISM Manufacturing Index monitors employment, production inventories, new orders, and supplier deliveries. A composite diffusion index is created that monitors conditions in national manufacturing based on the data from these surveys.
The Consumer Price Index (CPI) is a measure of the average change over time in the prices paid by urban consumers for a market basket of consumer goods and services.
Copyright © LPL Financial


