
by Lance Roberts, Clarity Financial
This past weekend I was at a “Super Bowl” party in my neighborhood. As a money manager, I like parties as they are a rather insightful indicator of the current psychology of the “average investor.” The great thing is that I do not have to do much other than stand in the middle of the room, have a drink in my hand, and wait. Generally, it doesn’t take long to find out where we are within the current investment cycle as one of three things will happen;
1. No one wants to talk about their investments;
2. A comment about investing might arise, or
3. They tell you everything about their latest investment success.
The chart below explains the concept.

The party this weekend was an example of the third stage. Wives were walking around with freshly injected lips and botoxed faces. Men were brandishing new Rolex watches while bragging about their latest acquisitions. I now know more about their personal stock portfolios than I do about their children’s latest successes.
As I discussed yesterday, there is a suspended disbelief that currently exists in the markets. Yet as I stated:
“There is one important truth that is indisputable, irrefutable, and absolutely undeniable: ‘mean reversions’ are the only constant in the financial markets over time. The problem is the next ‘mean reverting’ event will remove most, if not all, of the gains investors have made over the last five years.”
By the time, the sentiment of both individuals and professionals have become universally “bullish,” the markets have generally been near at least a short-term peak, if not worse. The only issue is the ability to know, with certainty, whether a particular peak will lead to a correction within an uptrend; or potentially something far more dangerous.
While I am not suggesting the market is about to crash; it does suggest investors are “all in” at this point with no real concern of the inherent risk. I can confirm that statement by the number of individuals that asked my opinion about every “high flier” stock in the market with a P/E with greater than 100x or worse, had no P/E because there were no earnings.
Of course, when I made the fundamental argument about the foolishness of investing that way, the conversation quickly ended with “yes, but I am making so much money.”
I have a sneaking suspicion I will probably not be invited to any more parties any time soon. However, it is apparent investor “greed” is back.
With that said, let’s take a look at the current bull and bear cases for the market.
THE BULL CASE
1) Participation Improving
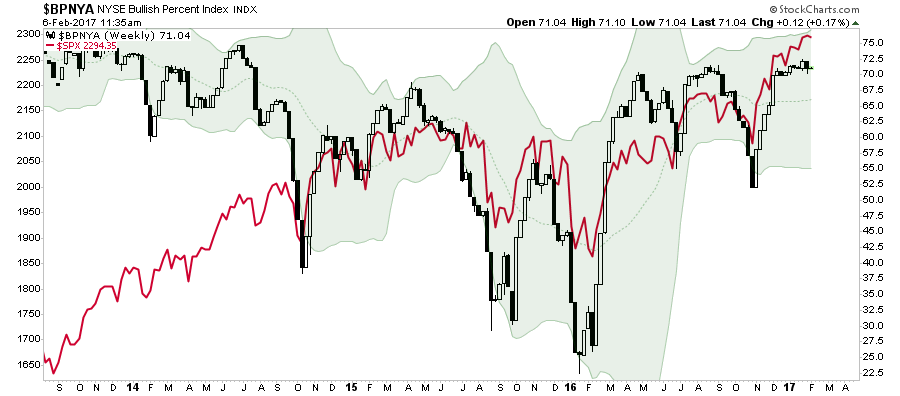
Following the election, the scramble to close out short-positions and chase the markets sent the number of stocks on bullish buy signals soaring higher. From a bullish perspective, the rising number of stocks on bullish buy signals remains supportive currently.
This same applies to the number of stocks hitting new highs versus new lows on the NYSE. The improvement in the number of stocks hitting new highs also supports the bullish short-term view. However, the negative divergence longer-term still remains problematic.
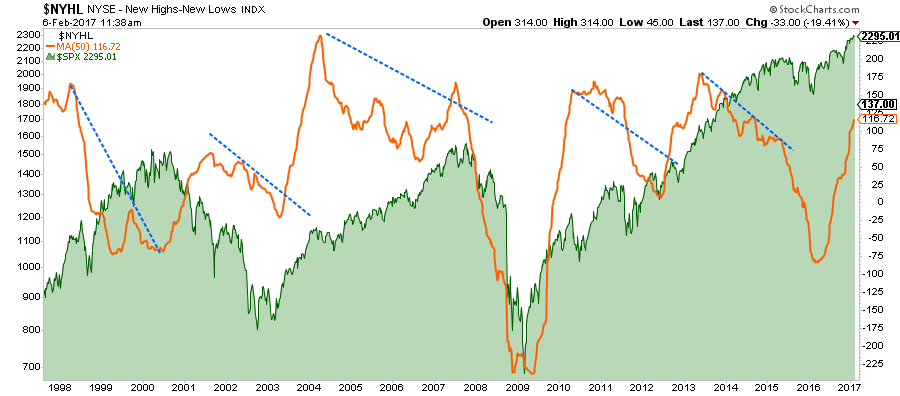
In both cases above, when these indicators turn down, it has normally been a good warning about a short-term consolidation or correction in the market.
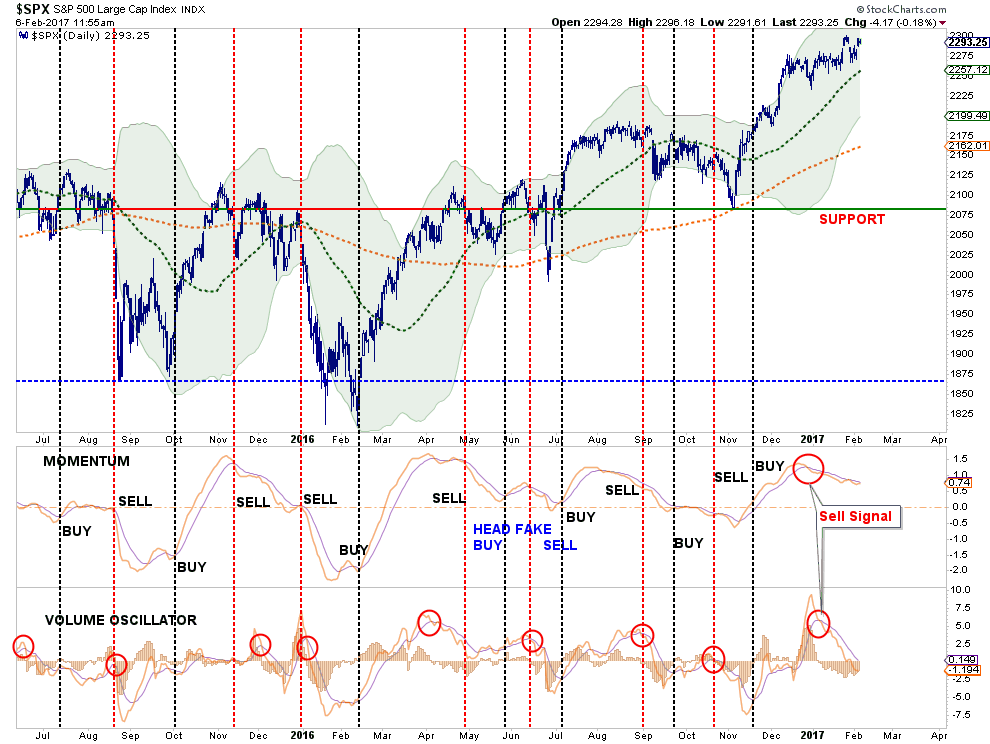
2) Stocks Made Successful Retest Of Support
As I discussed in last weekend’s newsletter, while there are certainly plenty of reasons to be cautious, there is still a case being made for a further advance in the markets. The market made a solid retest of the tops made in late 2015, and early 2016, leading up to the election. That retest of support, and subsequent breakout to new highs, confirmed the continuation of the “bull market” that began in 2009.
Furthermore, the price momentum of the market is rising from low levels set in early 2016 and remains positively entrenched. Again, this is supportive of the underlying bullish advance and keeps portfolios currently allocated towards equity risk.

It is worth noting the markets remain extremely overbought and the surge in the markets has likely priced in a lot of the fundamental benefits of any policy changes currently expected from the new Administration. The current extension of the markets above its moving averages certainly does not rule out the possibility of a correction in the short-term. A break of support and the current trend, which would currently be around 2100, will change the dialog significantly.
3) It’s The Carry Trade Stupid
Since 2009, as Central Banks swung into action liquefying the markets and removing investment risk by providing a proverbial “put” to market participants, the “yen carry trade” has been the cornerstone of the market’s advance.
As noted below, the use of the carry trade, (chart courtesy of David Larew), has continued to provide the support behind the bullish advance. While the markets are currently having a bit of weakness, given the strength of the underly “carry trade,” this will likely be another “buy the dip” opportunity for market participants.
Such a rise in participation suggests the momentum behind stocks is supportive enough to push stocks to higher levels and should not be dismissed lightly.
WARNING:
Let me be VERY CLEAR – this is VERY SHORT-TERM analysis. From a TRADING perspective, there remains a trading opportunity on “dips.” This DOES NOT mean the markets are about to begin the next great secular bull market. Caution is highly advised if you are the type of person who doesn’t pay close attention to your portfolio or have an inherent disposition to “hoping things will get back to even” if things go wrong rather than selling.
THE BEAR CASE
1) Short-Term: Market Rally On Declining Volume
The recent market rally, while strong, occurred amidst declining volume suggesting more of a short-covering rally rather than a conviction to a “bull market” meme.
The market is currently registering two short-term sell signals. With prices extremely deviated from the long-term moving averages, the risk of a correction in the short-term remains elevated
2) Longer-Term Dynamics Still Bearish
If we step back and look at the market from a longer-term perspective, where true price trends are revealed, we see a very different picture emerge. As shown below, the current dynamics of the market are extremely similar to those of the previous two bull market peaks. Given the deterioration in revenues, bottom-line earnings, and weak economics, the backdrop between today and the end of previous bull markets is consistent.
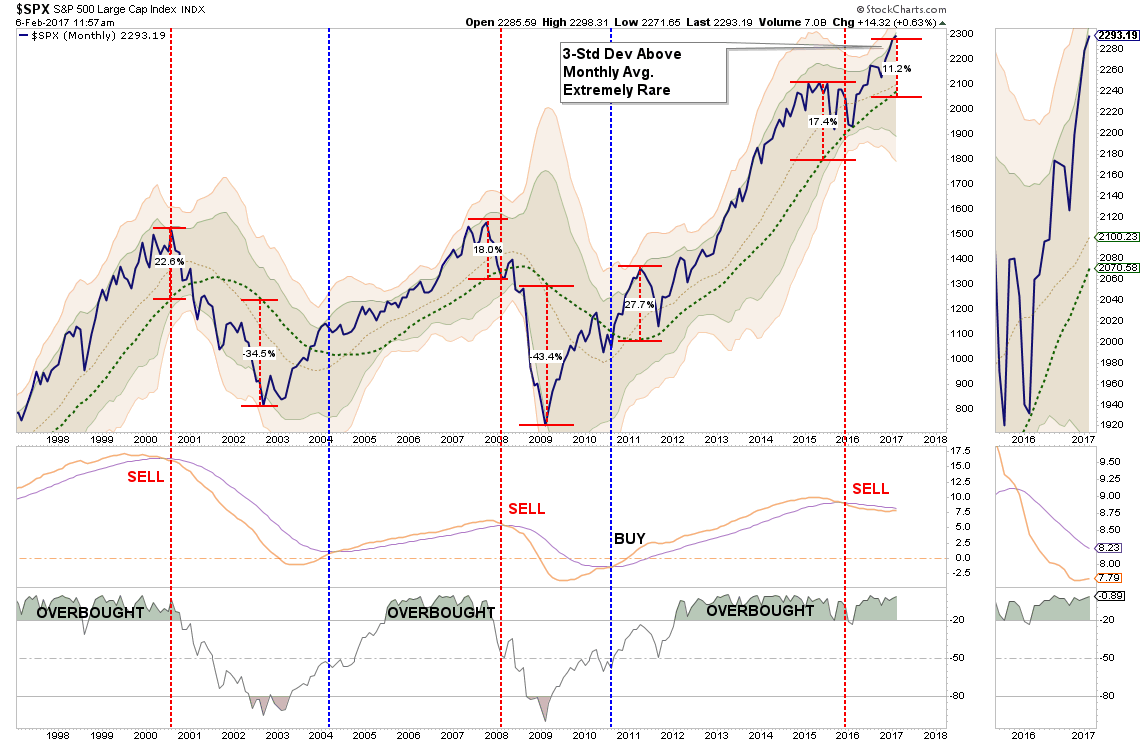
The market remains on a long-term “sell signal” and is pushing a 3-standard deviation extreme, which has only occurred at the peaks of previous bull market cycles.
Since this a very slow moving chart, the time-frame for the “end game” to eventually play out could be several more quarters into the future.
3) Bonds Ain’t “Buyin’ It”
Lastly, if a “bull market” were truly taking place we should see a flight from “safety” back into “risk.” That is currently not the case.
As shown below, previous peaks in the stock-bond-ratio has been coincident with both short and long-term market corrections.

Currently, we are not seeing “risk taking” being a predominate factor at the moment. Could this change? Absolutely.
But for now, it is worth watching this indicator. When it reverses, it has generally been a good indicator for reducing risk capital in portfolios.
What you decide to do with this information is entirely up to you. As I stated, I do think there is enough of a bullish case currently to warrant retaining equity risk in portfolios on a short-term basis.
However, the longer-term dynamics are clearly bearish. When those negative price dynamics are combined with the fundamental and economic backdrop, the “risk” of having excessive exposure to the markets greatly outweighs the potential “reward. “
Could the markets rocket up to 2400 as I have discussed previously? I think, given the “irrational exuberance” that currently exists, it is quite possible.
While the markets could reward you with another 100 points of upside, there remains a substantial risk of 200-400 points of downside.
Those are odds that Las Vegas would just love to give you.
Lance Roberts

Lance Roberts is a Chief Portfolio Strategist/Economist for Clarity Financial. He is also the host of “The Lance Roberts Show” and Chief Editor of the “Real Investment Advice” website and author of “Real Investment Daily” blog and “Real Investment Report“. Follow Lance on Facebook, Twitter and Linked-In
Copyright © Clarity Financial