by Corey Hoffstein, Newfound Research
- Position sizing is often the result of portfolio construction and is therefore largely overlooked in manager selection.
- Risks introduced by active strategies can change not only the absolute risk level of the portfolio, but also the relative composition of risk.
- Active risk can also create tracking error, which can lead to investor misbehavior if unchecked.
- We believe that understanding, monitoring, and adjusting for risk budget limits in absolute level, relative composition, and tracking error is critical for constructing a portfolio that investors can stick with over the long run.
Over the last couple of years, we have spilled countless pages of digital ink on the topics of active investing, with a specific focus on tactical approaches. Over time we have outlined what we believe are the crucial principles for successfully evaluating and incorporating active approaches into a portfolio.
Broadly, our philosophy is that active is best implemented when the approach is simple and systematic. We believe that the root cause for the expected outperformance should be sensible. When it comes to tactical, specifically, we believe that the implementation within the portfolio should be symmetric.
What we have not written much on is sizing (what is with us and S’s?).
Sizing is the determination of how much to allocate to a particular asset or strategy within a portfolio. Broadly, we believe that sizing falls into the category of risk budgeting: an important step in managing overall portfolio risk.
Often, in the realm of portfolio construction, sizing is the result of some sort of optimization process. However, when manager selection leads to the introduction of new, active risks, sizing should be revisted.
Sizing: Risk Level versus Risk Composition
Early last week, Ben Carlson penned a piece titled One of My Investing Pet Peeves over on his blog A Wealth of Common Sense.
In the article, Ben outlined his opposition to the argument that a 60/40 portfolio is really akin to having 90% of your risk in stocks and 10% of your risk in bonds (results we saw in the risk decompositions we performed two weeks ago).
As Ben accurately points out, it is a bit nonsensical to claim that 90% of your risk is in an asset class when if that asset class were to lose 100% of its value, you’d still have 40% of your portfolio left in bonds. The two ideas are somewhat at odds with each other.
We both agree and disagree with Ben and we think he is drawing an important line between absolute risk level and relative risk decomposition.
The 60/40 portfolio invokes a simple dollar risk budgeting approach. Put simply: you can’t lost more than you invest.
Note: We are specifically talking about traditional, long-only investments here. You certainly can lose more than you invest when you go short or use derivatives.
So by limiting the exposure in the portfolio to 60% equities, the absolute risk level is contained. A 60/40 portfolio will have a lower volatility profile than a 100/0 portfolio.
That said, when you perform a risk decomposition, the 60/40 and 100/0 will not look very different: nearly all the residual risk that does exist (post-diversification benefit) comes from equities.
Which means two things. First, traditional fixed income is not volatile enough to offset the wild swings in equities. Second, if the absolute risk level of equities rapidly climbs – as it did in 2008 – so will the absolute risk level of the 60/40.
While dollar risk budgeting is a prudent start, it clearly misses some potentially important subtleties of risk.
Why Size Matters
As a simple example, consider the Larry Portfolio, an allocation model we mentioned in last week’s commentary. Named after Larry Swedroe who first proposed the approach, the portfolio replaces the traditional large-cap equity exposure in a 60/40 with small-cap value equity exposure.
The idea behind the portfolio is that over the long run, both the size and value premia have created positive excess returns. Furthermore, the approach should increase internal diversification. While the original 60/40 is predominately exposed to market beta and interest rate risk, the small-value tilt incorporates size and risk factor into the equation.
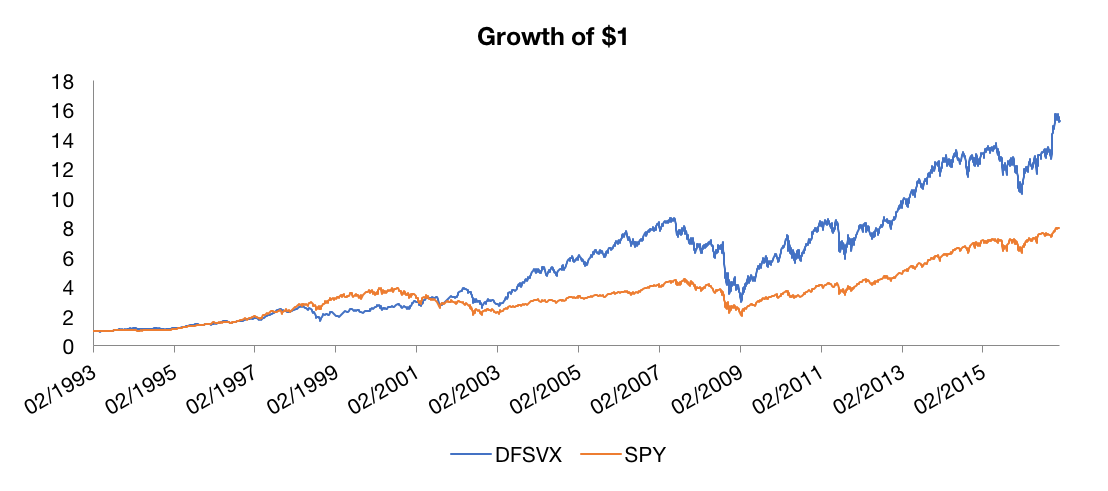
The historical excess return benefit can be seen by comparing the SPDR S&P 500 ETF (“SPY”) and the DFA US Small-Cap Value Fund (“DFVSX”).
Source: Yahoo! Finance. Past performance is no guarantee of future returns. Use of DFSVX and SPY are for example purposes only and do not constitute a recommendation.
The small/value tilt has been beneficial, with SPY returning 9.06% annualized over the period and DFVSX returning 12.14%.
Of course, the return has not been risk free: annualized volatility for SPY was 14.78% while for DFSVX it was 19.98%.
Therefore, blindly replacing large-cap equity exposure with small-cap value exposure in a 60/40 portfolio will increase the absolute risk level.
Therefore, to keep the absolute risk level constant, Larry reduces the equity allocation to 30%. Realized results since 2003 show that a 45% allocation to equities would have more closely matched the absolute risk level of a 60/40 – but the overall principal remains.
Yet we believe this approach still falls slightly short of optimal.
Why? In a word: behavior.
Managing Anxiety with a Tracking Error Budgeting
Evidence of performance chasing indicates the investors loathe underperformance.
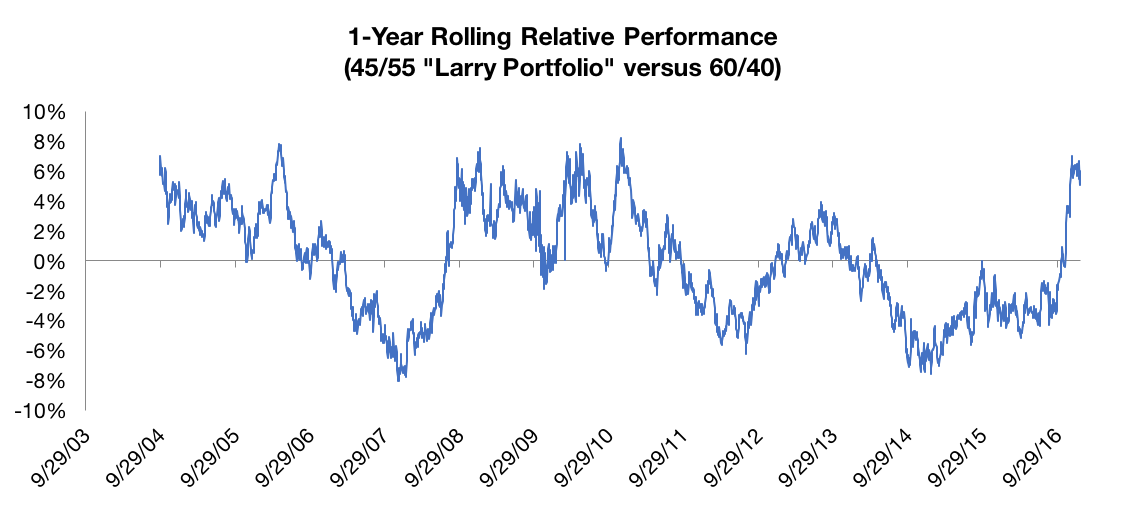
Consider the rolling 1-year relative performance of our standard 60/40 and the 45/55 Larry Portfolio.
Source: Yahoo! Finance. Calculations by Newfound Research. The 45/55 “Larry Portfolio” is an annually rebalanced portfolio that is 45% DFSVX and 55% AGG. The 60/40 portfolio is an annually rebalanced portfolio that is 60% SPY and 40% AGG. Past performance is no guarantee of future results.
Despite outperforming the 60/40 over the full period, the 45/55 Larry Portfolio went through a period from 9/30/2011 to 11/31/2016 where 80% of trailing 1-year periods underperformed the 60/40.
We’d wager that most investors would have happily jumped into this portfolio after its performance in the 2000s and would have abandoned it in the 2010s, missing out on the recent spike in relative performance.
In fact, the annualized tracking error (i.e. the sample standard deviation of realized monthly return differences) between DFSVX and SPY is 11.82% annualized. That means, over a 1-year period, there is approximately a 1-in-20 chance of seeing a +/- 24% relative return.
Even if we look at the portfolio level – namely comparing the 60/40 and the 45/55 Larry Portfolio – an annualized tracking error of 4.1% exists. That puts a 1-in-20 chance of seeing a +/- 8.2% relative return.
We don’t like the term error here. It implies something is wrong. Rather, using tracking error in this sense simply captures the idea that if you want performance that is different than the market, you’re going to get performance that is different than the market.
Which is rather tautological.
Nevertheless, it’s important to recognize that this performance differential will, inevitably, sometimes be bad. If that bad performance creates too much anxiety, then it can cause investors to make irrational short-term decisions.
As a simple back of the envelope calculation, we can estimate how much tracking error a position will introduce into the portfolio by calculating the tracking error between it and the position it is replacing, and scaling that tracking error by the square-root of the allocation it is replacing.
So, for example, if we were to simply replace SPY with DFSVX in the 60/40, we would expect to introduce a tracking error in the vicinity of SQRT(60%) x 11.82% = 9.15%.
In reality, this exercise is best performed using a covariance matrix to take into account correlation effects. With portfolio weights wp, benchmark weights wb, and underlying covariance matrix S, tracking error can be calculated as:
Or, put more simply, the tracking error is simply the volatility of the long-short portfolio we have constructed to move from the benchmark to the portfolio (note: all active portfolios can be thought of as a benchmark plus a long/short portfolio).
So in the case 45/55 Larry Portfolio, we are really holding the 60/40 benchmark plus a portfolio that is long 45% DFSVX, long 15% AGG, and short 60% SPY. The volatility of that portfolio is our tracking error.
Using this knowledge, an optimization can be designed such that we can replace SPY with DFSVX subject to both overall portfolio volatility constraints as well as tracking error constraints.
We’ll leave that as an exercise to the reader.
Conclusion
We believe that portfolio sizing is an incredibly important topic that often gets overlooked as it is often the result of asset allocation decisions.
However, when active risks are introduced through manager selection, we believe that it is a prudent topic to revisit.
Sizing has a profound effect on absolute portfolio risk level, relative risk contributions, as well as the tracking error the portfolio inherits that, when unchecked, can lead to irrational investor behavior.
We believe that understanding, monitoring, and adjusting for risk budget limits in absolute level, relative composition, and tracking error is critical for constructing a portfolio that investors can stick with over the long run.
Copyright © Newfound Research


