by Lance Roberts, Clarity Financial
I recently penned a post discussing various data points which were hitting record levels. To wit:
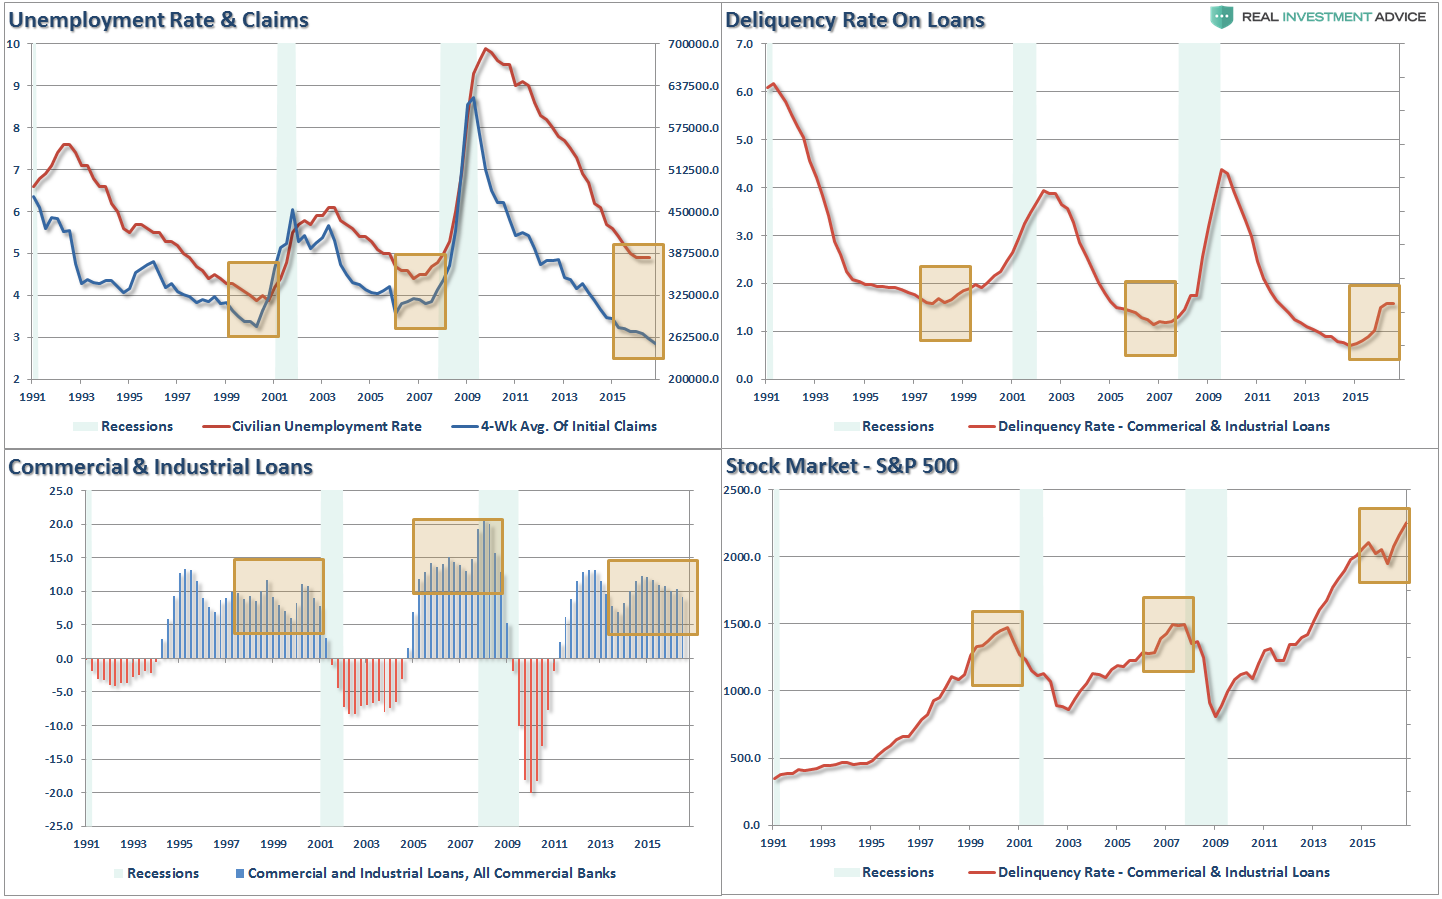
“First, “record levels” of anything are records for a reason. It is where the point where previous limits were reached. Therefore, when a ‘record level’ is reached, it is NOT THE BEGINNING, but rather an indication of the MATURITY of a cycle. While the media has focused on employment, record stock market levels, etc. as a sign of an ongoing economic recovery, history suggests caution. The 4-panel chart below suggests that current levels should be a sign of caution rather than exuberance.”
I want to add to the list above with 3-more indicators which are hitting historically high levels as well. Once again, while the mainstream media is touting exuberance over these high levels, my contention is they should be eliciting a sign of caution.
Consumer Confidence
There are many measures of consumer confidence but two of the most widely watched are the University of Michigan (UofM) and Conference Board (CB) surveys. Since the election both measures have independently soared sharply as “hope” has emerged that President-elect Trump can cause real economic change through tax reform, infrastructure spending and the return of jobs back to America. It’s a tall order to fill and there is much room for disappointment, but for now, “hope” is in the driver’s seat and according to the latest readings consumer sentiment has reached levels not seen since the turn of the century.
The chart below is a composite index of the average of the UofM and CB survey readings for consumer confidence, consumer expectations, and current conditions. The horizontal dashed lines show the current readings of each composite back to 1957.
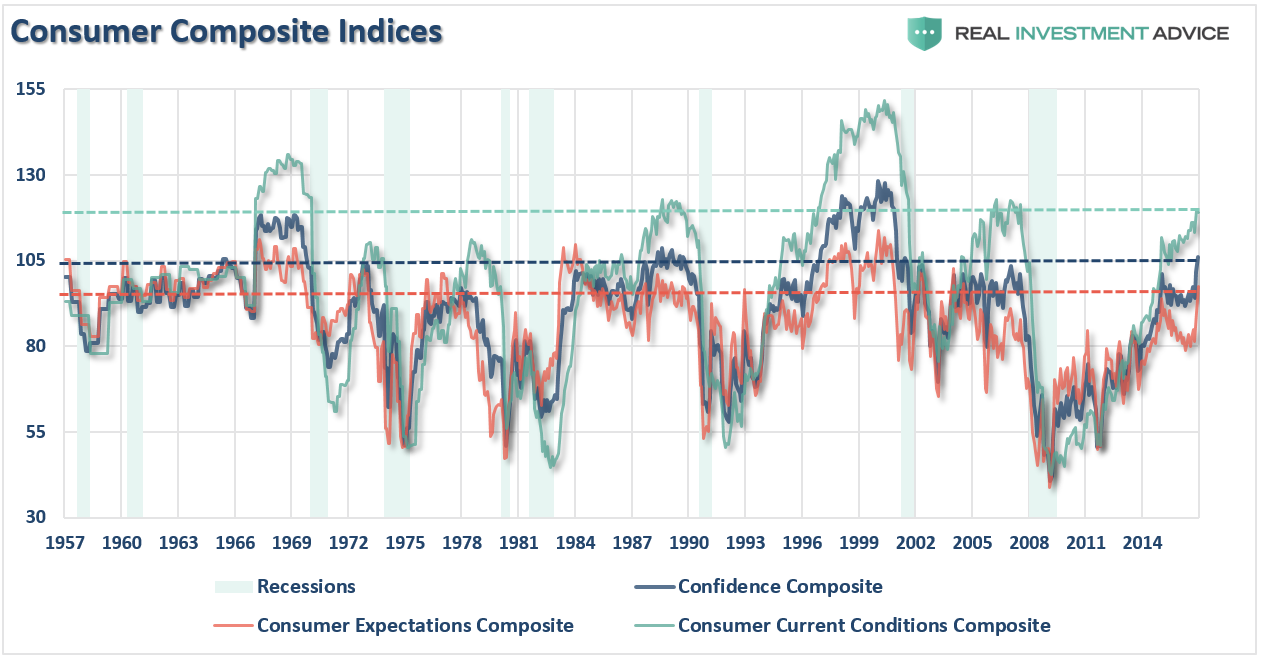
Importantly, as noted above, high readings of the index are not unusual. It is also worth noting that high readings are historically more coincident with a late stage expansion, and a leading indicator of an upcoming recession, rather than a start of an economic expansion.
The next chart shows the same analysis as compared to the S&P 500 index. The dashed vertical lines denote peaks in the consumer composite index.
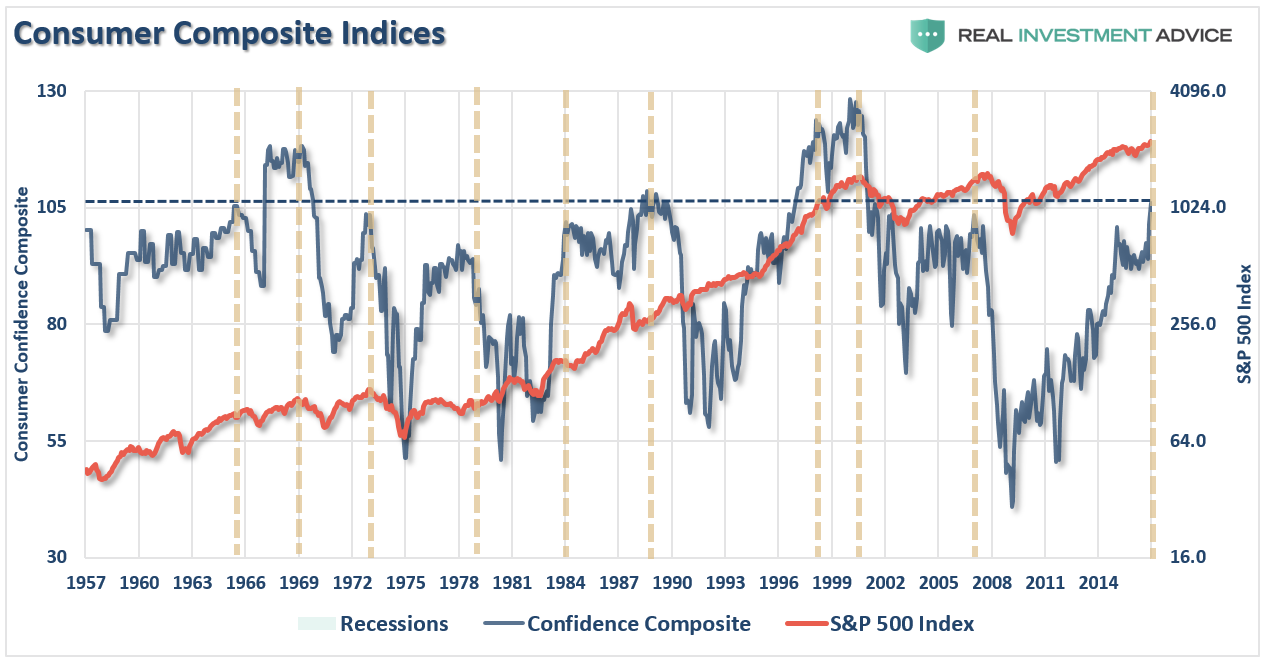
Again, not surprisingly, when consumer confidence has previously reached such lofty levels, it was towards the end of an expansion and preceded either a notable correction or a bear market.
Importantly, corrections did not always follow immediately after high levels were reached and that is not the point to be made. What is important to understand is all cycles have a beginning and an end and by the time any previous record has been broken, it has always marked the beginning of the end of the current cycle.
ECRI Leading vs. Lagging
A colleague and friend of mine is an avid follower of the Economic Cycle Research Institute (ECRI) data as it relates to economic cycles. While I don’t ascribe to the data as closely as he does, only because I use several other data sets that tell me roughly the same thing, I did note the ECRI Weekly Leading Index (WLI) just spiked to a peak not seen since 2007.

There is a very close correlation between the ECRI WLI and GDP as shown in the chart below. I have also included the Chicago Fed National Activity Index (CFNAI) which is a very broad measure of economic activity consisting of roughly 85 subcomponents.

Importantly, there is currently a rather significant divergence between the WLI and CFNAI measures. Historically, such divergences tend to correct themselves over the next several months with the WLI correcting back towards the CFNAI.
Furthermore, there is also a significant divergence in the ECRI leading and lagging data sets. These two data sets were very closely correlated until the turn of the century where they have become increasingly more detached. This is one reason, I suspect, the ECRI has struggled in recent years with its economic forecasts to some degree.

We can take these two indices and create an effective “book-to-bill” ratio by subtracting the lagging index (what actually happened) from the leading index (what we expect to happen). What we find is very interesting. The current level of the leading-lagging index has plummeted to the lowest levels on record with historical spikes lower associated with recessionary economic periods.
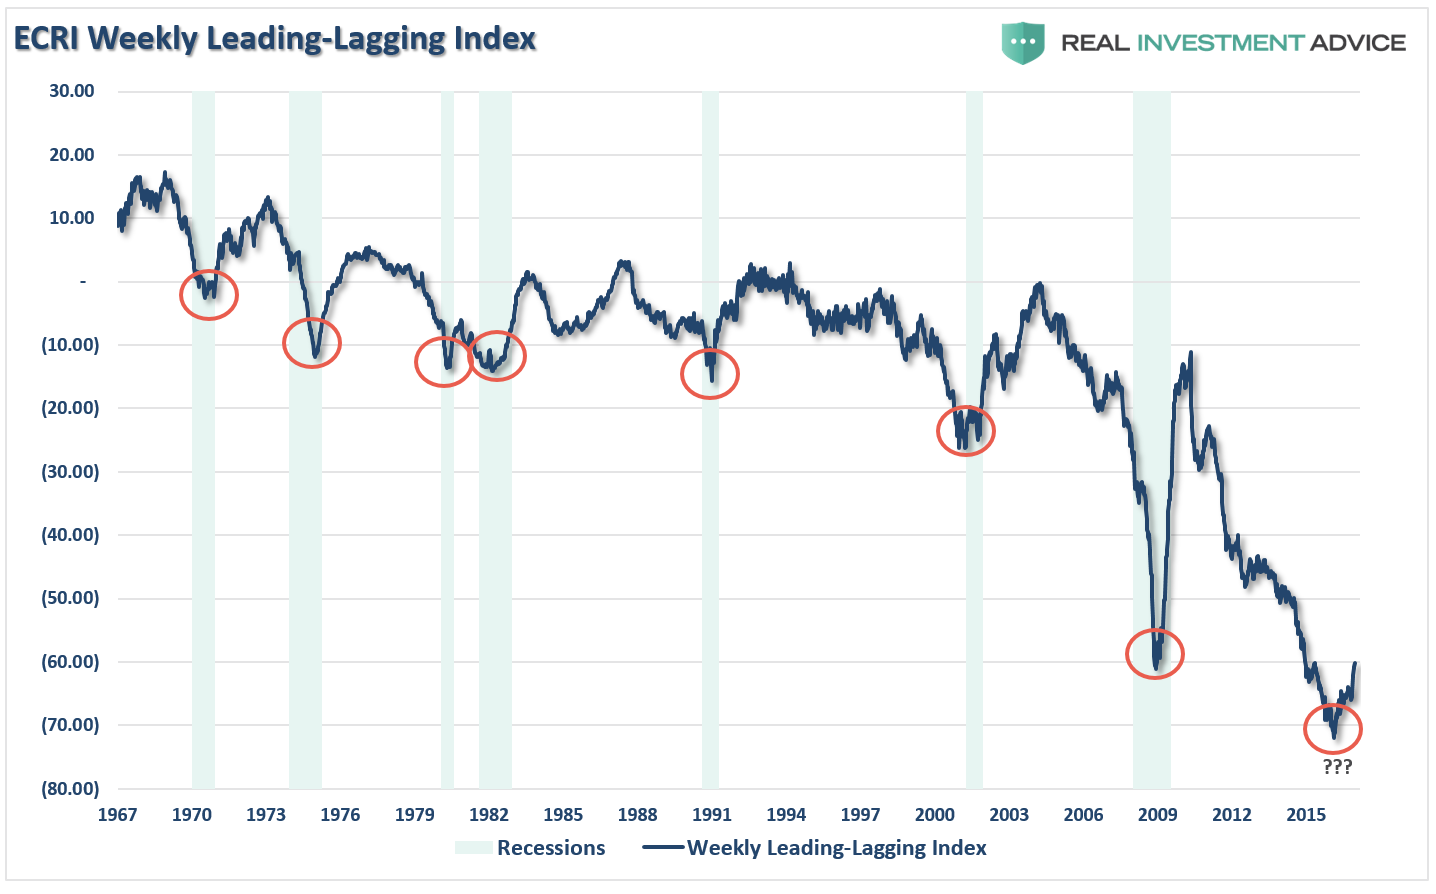
Of course, ongoing Central Bank interventions have seemingly prevented the onset of an economic recession in the U.S. currently. While this “time may be different,” I would remain exceedingly cautious betting on such an outcome.
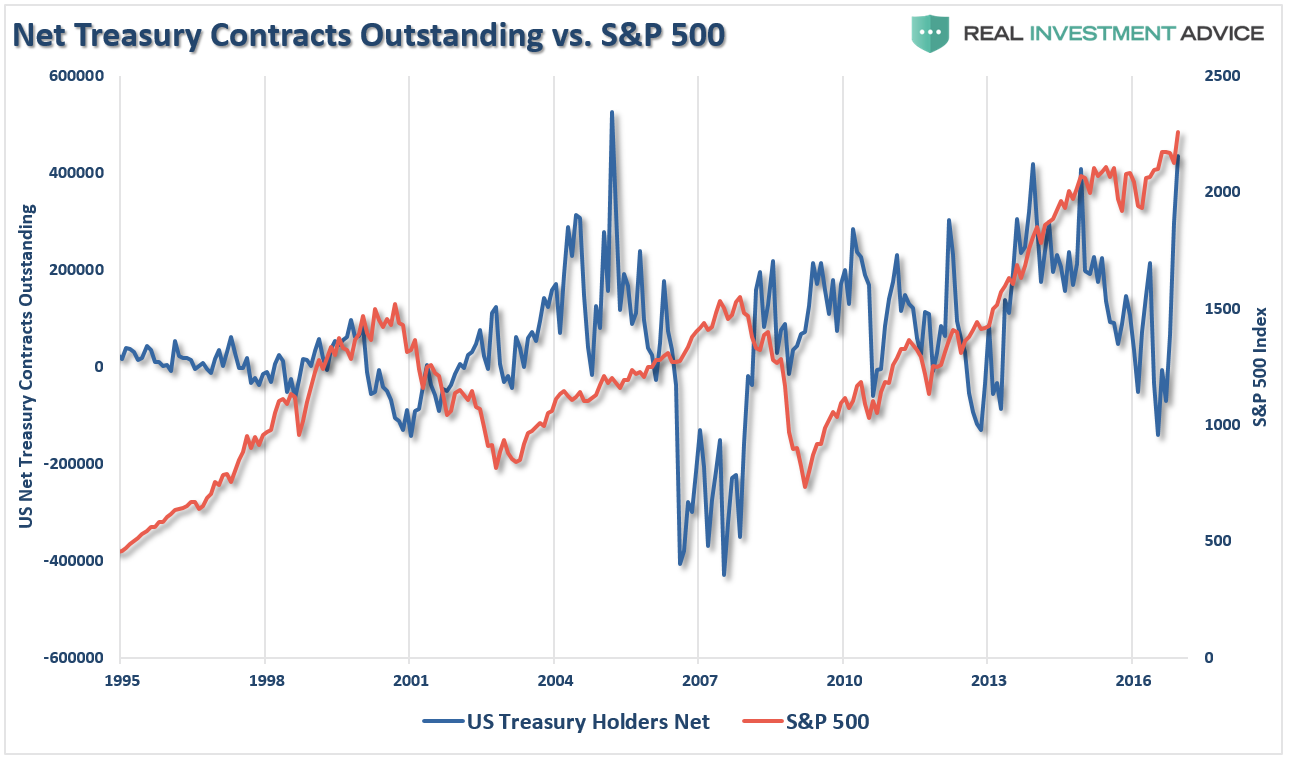
10-Year Treasury Net Longs Suggest Retracement
Speaking of “contrarian” indications, there is an overwhelming consensus following the election the replacement of monetary with fiscal policy is the “cure to economic growth” which has been missing. As such, interest rates have risen giving rise to the belief the “30-year bond bull market” is finally dead.
This may be a bit premature.
First, the policies currently being proposed from tax repatriation (Bush, 2004), tax cuts (Bush, 2001, 2003. Obama, 2010, 2012) and infrastructure spending (Obama, 2009) have, as noted, all been done before. While these actions did lead to short-term increases in rates, these policies were more beneficial to corporate bottom lines than actual economic growth.
“With global rates near zero or negative, money will continue to chase U.S. Treasuries for the higher yield. This will continue to push yields lower as the global economy continues to slow. What would cause this to reverse? It would require either an economic rebound as last seen in 50’s and 60’s, or a complete loss of faith in the U.S. to pay its debts through either default or the onset of the ‘zombie apocalypse.'”
Secondly, and from a pure investment standpoint, the positioning in 10-year Treasuries has returned to more extreme levels. As noted by the vertical dashed lines, when the 4-week moving average of net positioning rises sharply it has typically denoted a short-term peak in rates.

Not surprisingly, with everyone on the “same side of the trade,” any exogenous event which triggers a movement in the opposite direction tends to result in a stampede.
Furthermore, as I addressed in detail recently, a bulk of the rate rise since the lows has been directly related to rebalancing of holdings following Brexit and a fight by China to stabilize the collapse of the Yuan. To wit:
“It is important to understand that foreign countries “sanitize” transactions with the U.S. by buying treasuries to keep currency exchange rates stable. As of late, China has been dumping U.S Treasuries and converting the proceeds back into Yuan in an attempt to stop the current decline. The stronger dollar and weaker yuan increase the costs of imports into China from the U.S. which negatively impacts their economy. This relationship between the currency exchange rate and U.S. Treasuries is shown below. “
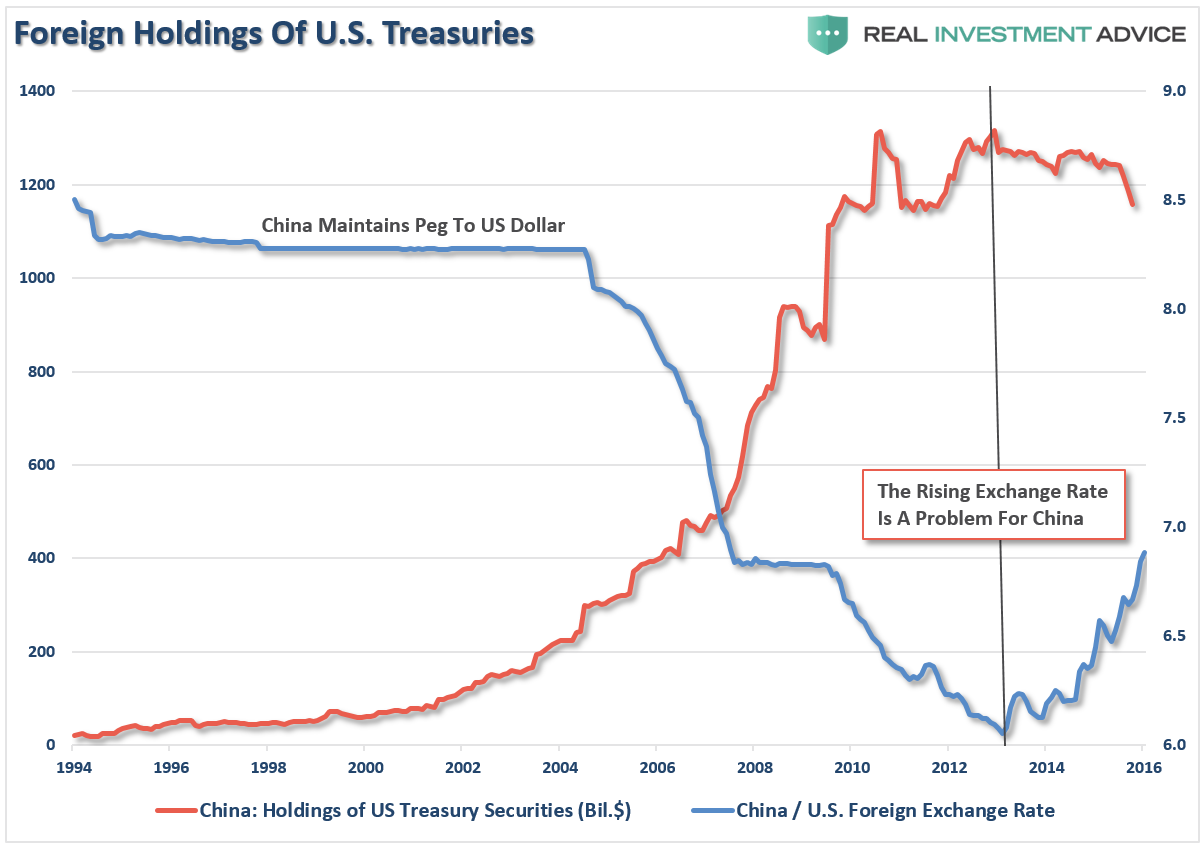
When this rebalancing ends, a potential reversal in rates back towards 2% would not be surprising. This will particularly be the case as deflationary pressures from the expected Trump policies take root over the next several quarters.
The next chart shows the weekly number of net contracts on the 10-year Treasury currently outstanding compared to the S&P 500. At the second highest level on record, such a contrarian positioning should provide some pause. Peaks in net positioning have often been associated with short to intermediate-term corrections, or worse, in the markets.
These are only a few of the indicators currently hitting more extreme levels. There are many more and they should not be dismissed in “hopes” things could be different this time. Maybe they will be, and the markets will rise indefinitely into the future. Since portfolios are already allocated to the markets, such an outcome will be welcome.
But, what if “this time is not different?”
Do you have the savings and investment time horizon to once again get back to even?
Do you have a plan of action to manage the unexpected?
“Hope” isn’t a plan to effectively deal with risks.
“It is always easier to regain a lost opportunity than trying to regain lost capital.”
Just some things I am thinking about.
Lance Roberts

Lance Roberts is a Chief Portfolio Strategist/Economist for Clarity Financial. He is also the host of “The Lance Roberts Show” and Chief Editor of the “Real Investment Advice” website and author of “Real Investment Daily” blog and “Real Investment Report“. Follow Lance on Facebook, Twitter and Linked-In
Copyright © Clarity Financial