


For this week’s edition of the Equity Leaders Weekly, we are going to re-examine the High Grade Copper Futures contract (HG.F) and the continued strengthening of the US semiconductor sector which we last spoke of back on the September 22nd edition of the Equity Leaders Weekly. As some of you may know both of these, at various times in the past, have been referred to as leading economic indicators by some. Back on September 22nd however, the High Grade Copper futures was trending to the downside while the US semiconductor sector was trending to the upside. Let’s revisit how these perceived 'leading economic' proxies have performed since then considering we have seen continued strengthening in the equity markets with US equity asset class moving to the #1 spot (from the #2 spot) in the SIA’s Asset Class Rank List and Int’l Equity strengthening to the 2nd spot from the 4th spot since we last spoke of these two topics.
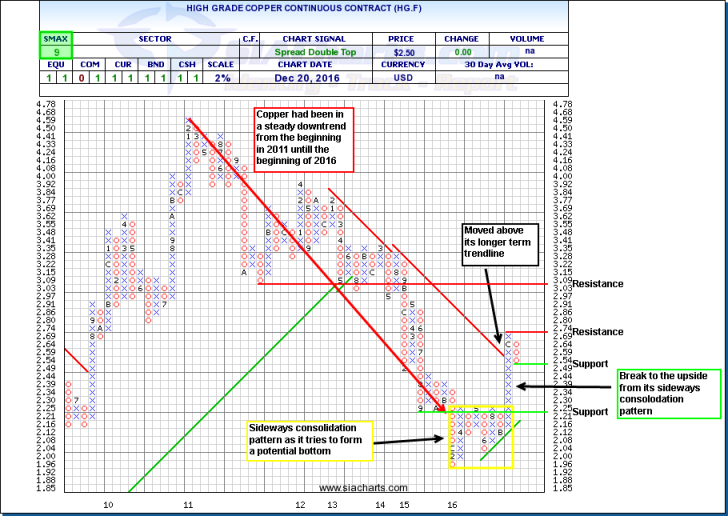
High Grade Copper Continuous Contract (HG. F)
Copper has been referred to as Doctor Cooper as it is the base metal known to hold a Ph.D in economics because of its ability to potentially help predict turning points in the global economy. Copper has widespread applications in many areas of the economy, so it is often viewed as an indicator of economic health by some economists. In looking at the attached chart, we see that copper has trended steadily downward since the beginning of 2011. From January 2016 to the beginning of November, we see that the price of copper had formed a sideways consolidation pattern trying to establish some sort of a bottom. Most recently an interesting trend has formed. Copper has broken out of its potential bottoming formation in the upside direction. It recently has moved above its long-term downtrend line at $2.54. A minor pullback has formed and we see the price of copper is currently testing the first support level at $2.49. If it breaks this support level, the next level of support is found at $2.21. It if manages to hold its support level, resistance can now be found at $2.74 and, above that, $3.09.
It will be interesting to see going forward if this early sign of strength in Copper can materialize further and if the past correlations between equities and Copper continue in the future at all or if this prognosticator shows divergence instead. With an SMAX score of 9 out of 10, Copper is currently showing near term strength against other asset classes.
Click on Image to Enlarge
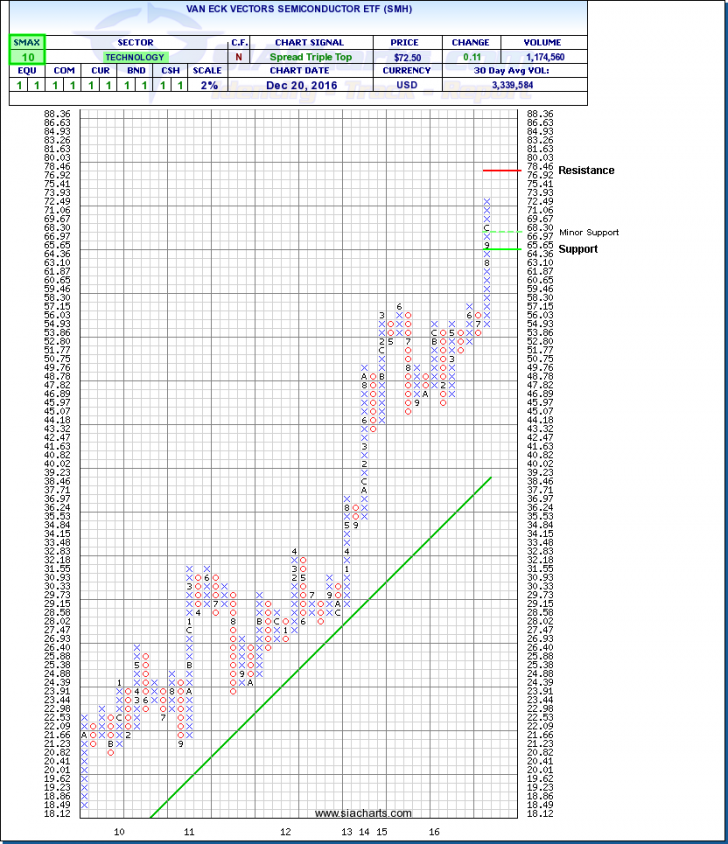
VanEck Vectors Semi Conductor ETF (SMH)
Let’s revisit the Semi conductor space, by using the VanEck Vectors Semi Conductor ETF (SMH) . Some analysts have watched this sector as a possible leading indicator for economic growth as well. The VanEck Vectors Semi Conductor ETF seeks to replicate as closely as possible, before fees and expenses, the price and yield performance of the MVIS™ US Listed Semiconductor 25 Index, which is intended to track the overall performance of companies involved in semiconductor production and equipment. These US companies that design, manufacture, and distribute semiconductors include names such as Intel, Texas Instruments, Qualcomm, Nvidia, and Broadcom. Today, we see that the ETF has continued to show considerable strength reaching higher highs.
The ETF is found in the SIA US Equity Specialty report and it currently sits in the Favored zone at the # 8 spot in the report. In fact it has been in the favored zone of this report for all of 2016. This a excellent example of how buying in our green zones can aid you in finding stronger investments that are trending in the right direction. Also of note, 4 of the top 8 names in the report all come from the semiconductor space. In looking at the attached chart, the first level of support is at the 3-box reversal at $66.97, and below that, stronger support at the 50% retracement level of $64.36. After such a strong run up It is very quickly approaching resistance at the $78.00 area. With an SMAX score of 10 out of 10, SMH is showing near term strength against all asset classes. It is up over 40% year to date.
Click on Image to Enlarge
SIACharts.com specifically represents that it does not give investment advice or advocate the purchase or sale of any security or investment. None of the information contained in this website or document constitutes an offer to sell or the solicitation of an offer to buy any security or other investment or an offer to provide investment services of any kind. Neither SIACharts.com (FundCharts Inc.) nor its third party content providers shall be liable for any errors, inaccuracies or delays in content, or for any actions taken in reliance thereon.
Copyright © SIACharts.com