
by William Smead, Smead Capital Management
As long-duration common stock pickers we seek to buy meritorious companies which fit our eight criteria for stock selection. However, as investors with a ten-year time frame and 36-years of observational experience in investing, we invoke Bernard Baruch who said, “The activity which made me the most money in common stocks was sitting on my hands.” For this reason, we have an interesting perch to watch the investors around us who are turning their portfolios over with regularity. How does an investor get a feel for shorter duration tops in the one-to-two year time range?
We believe that markets top by running out of buyers and that markets bottom when you run out of sellers. A quick history would be helpful. Nobody was left to buy oil stocks in 1980 at $40 per barrel and nobody was left to sell in 1999 near $10 per barrel. Investors shunned tech stocks in 1991, when they ran out of sellers. By the end of 1999, research analysts were falling all over themselves to up the price targets on Amazon (AMZN), Cisco (CSCO), Microsoft (MSFT), Sun Microsystems, EMC (EMC), and others. Microsoft just broke through to a new all-time high recently after going 16 years without one! Some of those analysts ended up getting run out of the business for their tomfoolery.
Everyone thought the boom in residential real estate could never end in 2005, until the last liar loan was made and nobody was left to buy. The theory was that residential real estate prices never go down across the country simultaneously. In 2010-2011, there were attractive foreclosures and short-sales galore with nobody left to sell. How can you know whether to sit on your hands and stay with winning common stock holdings?
Our first tool is to follow the industry research analysts. At one-to-two year sector or industry tops, the analysts enthusiastically raise the price targets on the most popular stocks in the category. In early October of 2016, those who followed revenue-growth stories like Amazon and Netflix (NFLX) were falling all over each other to outbid their peers on price targets (shades of a mini-1999). This always makes us nervous, because it hints potential stock buying demand may have temporarily run out for stocks like Amazon, which made a peak around $844 on October 6, 2016. Examples of these price target increases on Amazon included:
• Susquehanna $950 to $1,250 in late October1
• JPMorgan increased from $925 to $1,000 in late September2
• SunTrust leap-frogged by Morgan Stanley upping their price targets on Amazon3
Needless to say, investors have been urged to buy the dips since then. We have no special expertise to determine which of today’s glamour tech stocks will reward people over ten years, but history argues that high expectations and high stock price valuations have been destroyers of wealth as often as they are creators.
Let us contrast the bullish affirmations of tech stocks recently with the research analysts who follow our largest banks. The big banks like JPMorgan (JPM), Bank of America (BAC) and Wells Fargo (WFC) have rallied in the last three months—and the rally accelerated with the election of Donald Trump and a Republican Senate majority. Numerous major analysts have come out with downgrades, and in at least one case, a brand new sell recommendation on Wells Fargo.4 How should the long-duration investor deal with these circumstances?
First, look at valuation. The banks have been hated for nine years both in stock price and in the arena of public opinion. They trade anywhere from less than book value to 1.5 times book. A look at the chart below shows the price-to-book value ratio of Bank of America, as compared to the ratio for the S&P 500 Index since 1989.5 The evidence argues that stocks like Bank of America are still a bargain from a historical standpoint.
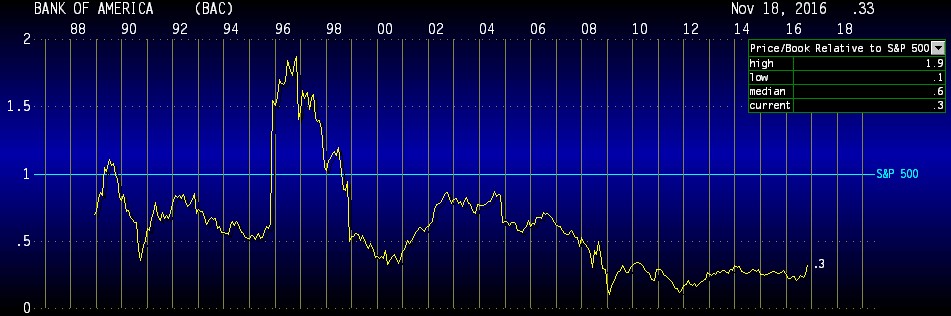
These bank stocks are not at prices even vaguely close to dangerous intermediate or long-duration tops, which indicates that numerous potential buyers still exist. Again, this doesn’t mean they can’t go down in price or go through a temporary correction. It means to us that whatever correction happens, will end up just being noise over the long haul.
For the long-duration investor, it appears to us that the bank stock train has just left the station, is scheduled for a long trip and is early in a secular phase of success. Tech darlings like Amazon and Netflix trade at nosebleed price-to-earnings (P/E) multiples. If the promise expected by the optimistic analysts plays out in full, they could very well reward growth stock investors. Very high P/E ratios guarantee nothing, but they do establish potential risks. Who is left to sell the banks and who is left to buy the tech darlings?
Second, consider the era we are about to enter. We believe the next ten years will be all about the move by our Millennial population (86 million Americans) to get married, have kids, buy houses and lease or buy cars. This demographic shift begs the question: Will this change in priorities be more advantageous for the banks, or would it be better for the banks if 25-35 year old Americans stay single, frequent bars and buy the latest Apple devices forever?
We would argue that Black Friday and Cyber Monday might run into HGTV, local-affiliate TV news and PTA members watching them. The nation of baby-boom Americans is dying to have grandchildren and ready to spoil them. Those in the political realm seem to have decided that Americans on Main Street deserve an era in the sun.
Lastly, you need to look at how heavily-owned certain companies are by the S&P 500 Index and the community of active managers. As of Friday, November 18, 2016, tech stocks at 21% of the index are far and away the largest category in the S&P 500. Tech stock preeminence is even bigger in the index if you include Amazon and Netflix at 1.8% of the index (15% of the consumer discretionary sector). If you ask an Amazon employee, they will tell you that they consider it a technology company. If we take them out of the consumer discretionary category and put them in the tech sector, it would make tech stocks 22.8% of the S&P 500 Index.
Heavy ownership of darlings is historically exposed when the value investing managers stretch their criteria to include them in their portfolio. We see that among our competitors and among large value-oriented hedge-fund managers. The top could come some day in banks when growth managers are forced to include them due to multi-year earnings growth success. We like our long-duration holdings at nice discounts to the average stock and we like our bank stocks for the long haul.
Warm Regards,

William Smead
1Source: The Country Caller
2Source: TheStreet
3Source: TheStreet
4Source: theflyonthewall
5Source: Bloomberg
The information contained in this missive represents Smead Capital Management’s opinions, and should not be construed as personalized or individualized investment advice and are subject to change. Past performance is no guarantee of future results. Bill Smead, CIO and CEO, wrote this article. It should not be assumed that investing in any securities mentioned above will or will not be profitable. Portfolio composition is subject to change at any time and references to specific securities, industries and sectors in this letter are not recommendations to purchase or sell any particular security. Current and future portfolio holdings are subject to risk. In preparing this document, SCM has relied upon and assumed, without independent verification, the accuracy and completeness of all information available from public sources. A list of all recommendations made by Smead Capital Management within the past twelve-month period is available upon request.
Copyright © 2016 Smead Capital Management, Inc. All rights reserved.