With the recent activity and all of the excitement in the markets, it was difficult to choose where to focus for this week’s edition of the SIA Equity Leaders Weekly. For the major US equity indies, we are seeing significant breaks into historical high levels: the Dow Jones Industrial Average breaking through 19,000, the S&P 500 above 2200, and the Nasdaq Composite through 5375; with the odds now for a December interest rate increase currently at 100% (according to recent Bloomberg calculations), the immediate impact was a strengthening US dollar, falling gold price, and rising equity markets. Therefore, for this weeks ELW we are going to examine the S&P 500 and the U.S. Dollar Indices.
S&P 500 Index (SPX.I)
Just as President-elect Donald J. Trump is getting ready to take office in the new year, yesterday’s revised University of Michigan Consumer Sentiment told the story that not only is the market seemingly happy with the change, but also suggests Americans in general were encouraged overall by Trump’s victory over Hilary Clinton. What we are seeing so far in this new investment climate is that investors are taking money out of bonds and putting them into equities, and predominately US equities which are seeing the biggest boost. According to Barclays Research, last week US equity funds saw inflows of $31 billion; their largest inflow ever, and much of that into ETFs. Now whether this honeymoon period will continue in the same direction will depend entirely on future economic improvements; cautiously optimistic, the world watches on.
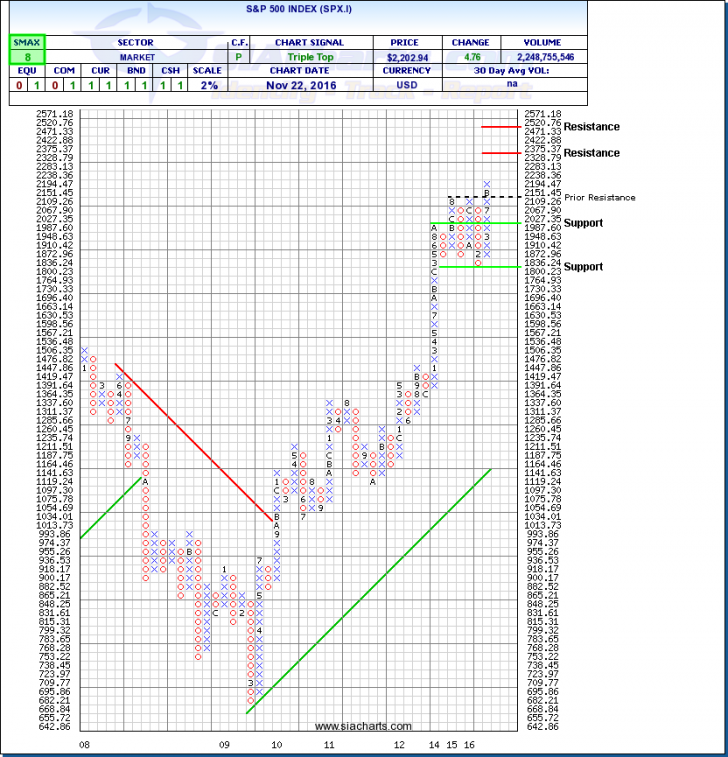
Drawing our attention to the chart of the S&P 500 Index, we can see the significant break that recently took place through the multi-year and very stubborn $2151 resistance level. That prior resistance level will now serve as a new and important support level to be tested during future market retracements. Looking ahead, additional resistance is seen at around 2350, and then higher at 2500; major support below the newly mentioned level, is seen at 2000, and below at 1800. With an SMAX of 8 out of 10, the SPX continues to show near-term strength against the asset classes.
Click on Image to Enlarge

US Dollar Index Continuous Contract (DX2.F)
The US Dollar Index is a broad measure of the value of the United States dollar relative to a basket of foreign currencies. This basket includes the following currencies: Euro (58%), Japanese yen (14%), Pound Sterling (12%), Canadian dollar (9%), Swedish krona (4.2%), and Swiss franc (3.6%).
On Tuesday, as per Bloomberg calculations based on futures, for the first time ever the markets implied odds of a US interest rate hike at next months Federal Reserve meeting reached 100%. As mentioned above, some of the immediate affects were a strengthening US dollar, falling gold prices, and a strengthening stock market. Yesterday, also after strong economic data including upbeat durable goods data, the US Dollar Index moved into levels not seen in 13 years. In reaction, gold bullion futures which trade inversely to the USD fell below $1200 per ounce for the first time since February.
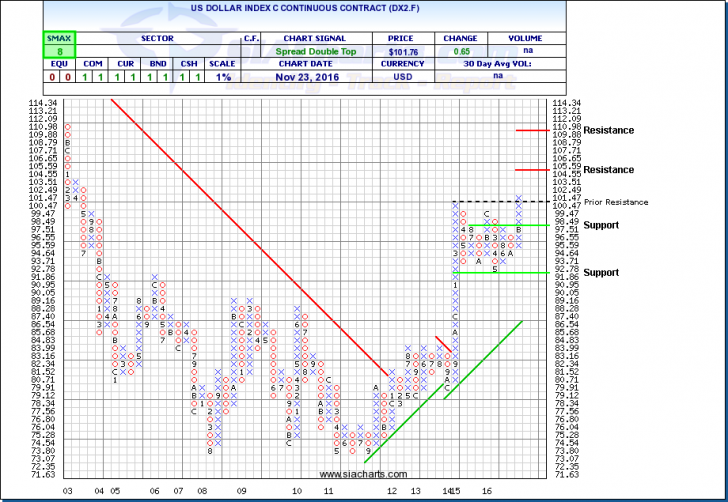
Drawing our attention to the chart of the DX2.F, we can see the significant break that took place yesterday through the multi-year resistance level at 101.47. Like the S&P 500 chart, that prior resistance level will now serve as a new and very important support level to be tested during future market retracements. Looking ahead, additional resistance is seen above 105, and then higher through 110; major support below the newly mentioned level, is also seen at 97.51, and below through 92. With an SMAX of 8 out of 10, the US Dollar Index is showing near-term strength against the asset classes.
Click on Image to Enlarge

SIACharts.com specifically represents that it does not give investment advice or advocate the purchase or sale of any security or investment. None of the information contained in this website or document constitutes an offer to sell or the solicitation of an offer to buy any security or other investment or an offer to provide investment services of any kind. Neither SIACharts.com (FundCharts Inc.) nor its third party content providers shall be liable for any errors, inaccuracies or delays in content, or for any actions taken in reliance thereon.
For a more in-depth analysis on the relative strength of the equity markets, bonds, commodities, currencies, etc. or for more information on SIACharts.com, you can contact our customer support at 1-877-668-1332 or at siateam@siacharts.com.
Copyright © SIACharts.com


