


by Lance Roberts, Clarity Financial
I recently penned a post discussing the idea of a “new secular bull market,” which, not surprisingly, garnered a good bit of push back from the “always bullish crowd.”
However, while the thesis of a new secular bull market is interesting, it is based on some flawed assumptions on interest rates, valuations and time frames.
Interest Rates
The first assumption was that interest rates have now begun a secular shift higher based simply on the premise that rates are so low they must now go up.

While the chart clearly shows that interest rates have hit the same levels as last seen in 1946, the view rates will rise strongly from current levels assumes that the same economic drivers exist today. In 1946, the United States had just exited WWII which left Europe and Japan in ruins. The United States became the manufacturing center of the industrialized world as we assisted in the rebuilding of Germany, Britain, France and Japan. That is no longer the case today as much of our industrial manufacturing has been outsourced to other countries for lower costs, technology has replaced jobs by increasing productivity, and demographic trends now weigh against stronger economic growth rates.

Importantly, interest rates are a reflection of actual economic growth, rising pricing power for goods and services, and wage growth across the bottom 80% of employees. The chart below shows interest rates overlaid against the annual changes in those factors.

While there are many “hopes” currently economic growth will pick up in 2017, just as there have been in every year since the financial crisis, the structural and demographic headwinds remain present. With the consumer heavily indebted, wage growth muted and global economies running at very weak rates, the ongoing demand for lower prices on goods and services will require continued wage suppression through “job exportation” and lower financing costs to maintain profitability. Therefore, there is very little room for rate increases before an “economic dampening” occurs which will keep a lid on interest rates in the future.
This has been the ongoing problem for Japan which has seen interest rates stuck at low levels for the last two decades.

While there are many arguments that we are not Japan, with which I agree, there are many similarities from an economic perspective.
Valuations
The second argument for entry into a secular bull market is based on valuations.
The S&P 500 currently trades at 16.71x this year’s bottom-up operating earnings estimate.
In their seminal book ‘Security Analysis,’ Graham & Dodd published an equation about how to calculate a proper Price to Earnings Ratio (P/E). The formula was:
P/E = 8 + (2 x Expected Earnings Growth)
It is currently expected that this year’s operating earnings growth will be 10.24% from last year. Since estimates are consistently overly estimated by 33%, it is likely this assumption will turn out to be too high. However, lets’ assume it is correct for the moment, despite higher interest rates and a strong dollar, and companies are able to add an additional $9/share in earnings from Q3 of this year. This would put the current Q4-P/E (2164 / $109) at 19.84x.
If next year’s earnings estimate of $131.18 is anywhere close to the mark, it would suggest a year-end price of 2,602 (19.84x * $131.18) for the S&P 500.
That statement should get just about everyone excited as such would imply a surge of 20.01% in 2017 from the current price levels.
However, there is a huge problem with this analysis.
Graham & Dodd never used forward operating earnings in the analysis as such metrics were not used when they published their seminal work. Graham focused on reported trailing earnings and always suggested in using an average of earnings (using a 5,7 or 10-year time frame) to smooth out anomalies. This smoothing of earnings was the basis for Professor Robert Shiller’s work on smoothing inflation-adjusted earnings using a 10-year average.
Using reported earnings estimates for Q3-2016, which is the last fully completed quarter, and using the current price of 2164, the current P/E ratio is 24.20x earnings. From just about any historical perspective, the markets are now expensive. However, if we correctly use Graham’s formula using reported earnings, and the historical growth rate of earnings of 6%, we get the following valuation:
P/E = 8 + (2*6) = 20x
Let’s assume, since forward estimates are historically overestimated by 30%, that forward estimates come in at $112/share which would be a 25% increase from current levels. This would imply a target of 2240 for 2017 or a return of 3.3%. Importantly, a 3.3% rate of return from such levels of high valuation would be consistent with historical norms.
If we use the current forward estimates for reported earnings in 2017, revised down from $122.60 to $112 per share, and use estimated year-end reported earnings for 2016 of $99.89, the earnings growth rate is 10%. Graham’s formula then changes to:
P/E = 8 + (2*10) = 28x
Such a valuation would exceed every other secular bull market valuation peak in history with the exception of the “tech bubble” in 2000. The chart below shows the historical P/E ratio using trailing reported earnings from 1900-present. I have capped P/E’s at 25x to give you a perspective on longer-term investment cycles as they relate to valuations.

However, a P/E ratio of 28x reported earnings would imply a target for the S&P of 2509 or a 15% rise from current levels over the next 12 months. While such a price rise could conceivably occur, the likelihood of such an increase in the current environment is unlikely. The most likely outcome will either be a disappointment in earnings, prices or both.
Time Frames
Lastly, a discussion focused on time frames is important.
There are many who are currently espousing that a new “secular bull market like the 1982-2000 affair.” began with the breakout of the markets to new all-time highs in 2013.
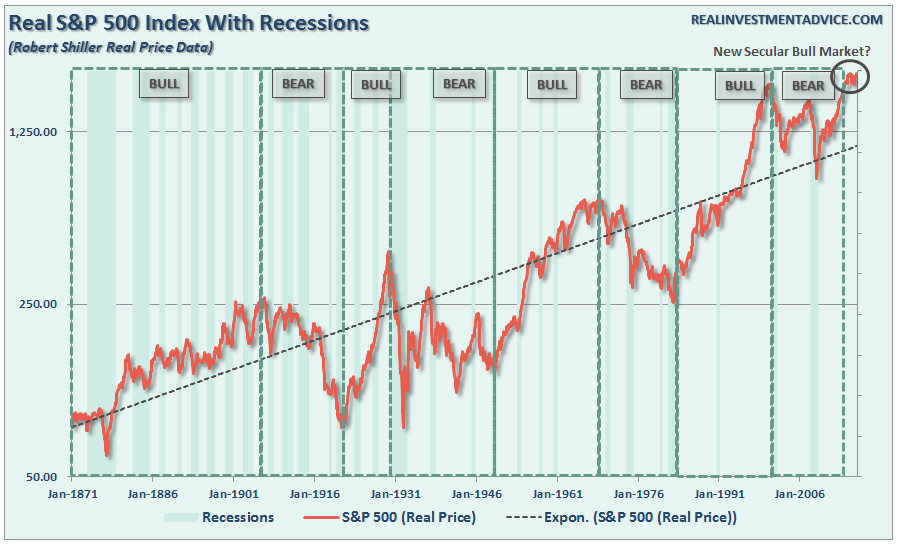
First, the chart shows the secular bull/bear markets back to 1871. While the average “secular period” has average 14-years, that average was skewed by the very short secular bull market of 5+ years leading up to the 1929 peak. More importantly, while it is assumed the secular “bear market” ended at 13 years, the average historical secular bear market has averaged 17 years. In a complete vacuum of other data, it would suggest that the current secular cycle still more room to go, and one more nasty decline, to complete the cycle.
But there is a more important point that is consistently overlooked in the attempt by the mainstream media to promote a bullish case. As shown in the chart below, investors tend to use a significant chunk of the “secular bull” market periods just getting “back to even.”
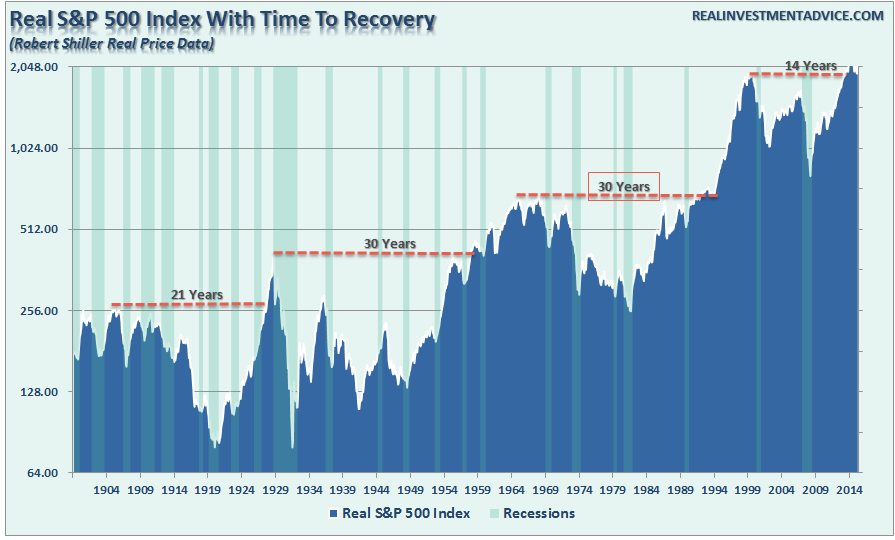
In other words, for most investors, the process of “getting back to even” left them far short of the investment goals they began with. This is why the current labor force participation rates of those well into retirement years are at the highest level on record. They aren’t working because they “want” to, it’s because they “have” to.

Secondly, the ability to have a “1982-2000 affair” is highly improbable. The 1982-2000 secular bull market cycle was driven primarily by a multiple expansion process with a beginning valuation level of 5-7x earnings and a dividend yield of 6%. Interest rates and inflation were at extremely high levels and were at the beginning of a 30-year decline which would increase profitability as production and interest rate costs fell. Lastly, the consumer was at the beginning of a period of a leverage ramp up which spurred consumption levels to almost 70% of GDP.
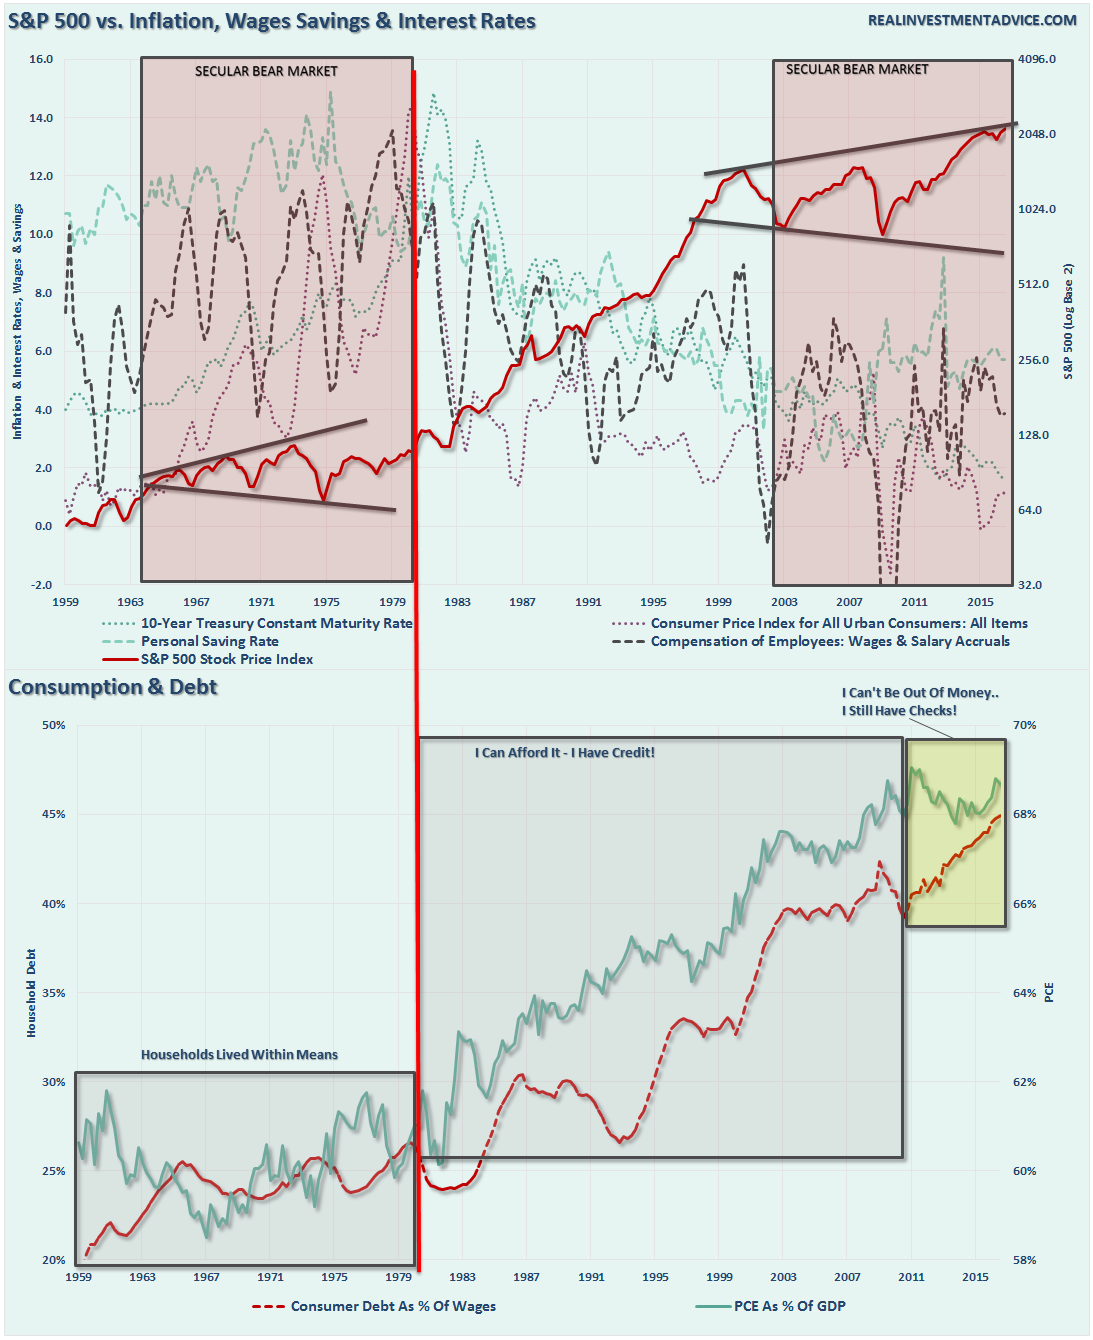
With inflation and interest rates currently at low levels, and consumers already heavily levered relative to historical norms, the drivers that led to the secular bull market in of the 80-90’s simply do not exist today.
Conclusion
While being a “stark raving bull” going into 2017 is certainly fashionable currently; as investors, we should place our faith, and hard earned savings, into the reality of the underlying fundamentals. It is entirely conceivable the current momentum driven markets, fueled by ongoing Central Bank interventions combined with optimism over the potential for economic reforms under the new administration, could certainly drift higher in the months to come. However, the reality is that the current underlying demographic trends, economic realities, and market fundamentals do not provide the base to support current price levels much less the entrance into a secular bull market akin to that of the 80’s and 90’s.
Of course, with virtual entirety of Wall Street being extremely bullish on the markets and economy going into 2017, along with bullish sentiment at extremely high levels, it certainly brings to mind Bob Farrell’s Rule #9 which states:
“When all experts agree – something else is bound to happen.”
There are simply too many things we “don’t know that we don’t know.” For that reason alone, 2017 could well turn out to be an interesting year for all the wrong reasons.
Lance Roberts

Lance Roberts is a Chief Portfolio Strategist/Economist for Clarity Financial. He is also the host of “The Lance Roberts Show” and Chief Editor of the “Real Investment Advice” website and author of “Real Investment Daily” blog and “Real Investment Report“. Follow Lance on Facebook, Twitter and Linked-In
Copyright © Clarity Financial